[TP03] Land take

Key message

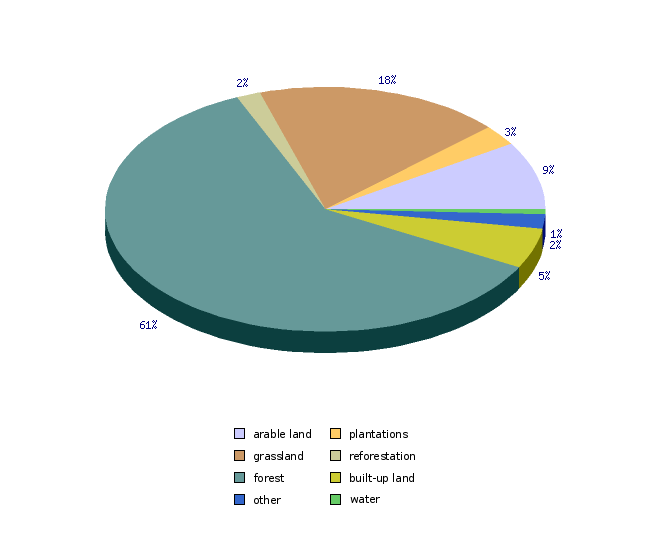
Over the period 2008–2012, the area of built-up land, representing 5.4% of land use in Slovenia, increased. The percentage of built-up land is distinctly higher in the Central Slovenia and Podravje statistical regions. The existing data sources do not allow a precise quantitative evaluation of the process of land conversion to urban/residential/industrial use.
Definition
This indicator shows the actual overall area of built-up land in 2012 (all built-up residential areas, infrastructure areas, industrial and commercial areas, tourist and sports infrastructure areas, etc.) in hectares, as well as land use change from all categories (agricultural land in particular) into the category of built-up land in the period 2008–2012.
Thus, the indicator shows the process of land use change and its effect on unsustainable land use due to development of various human activities, which is reflected in the increased area of built-up land and permanent loss of forest and agricultural land.
Charts
Record of the use of agricultural and forest land 2008 and 2012. Ministry of Agriculture and Environment, 2012.
| arable land | plantations | grassland | reforestation | forest | built-up land | other | water | ||
|---|---|---|---|---|---|---|---|---|---|
| 2008 | hectars | 181384 | 51759 | 375078 | 28255 | 1241343 | 108961 | 31791 | 13430 |
| 2012 | hectars | 182739 | 54740 | 368155 | 36209 | 1229734 | 109163 | 37844 | 13417 |
Record of the use of agricultural and forest land 2008 and 2012. Ministry of Agriculture and Environment, 2012.
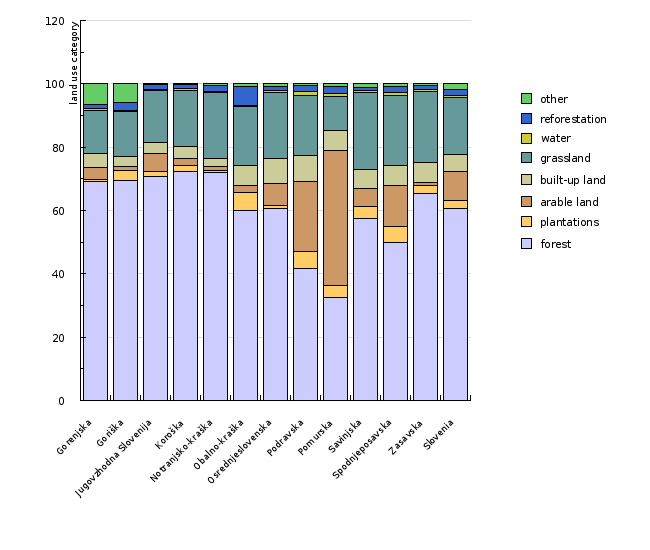
| Gorenjska | Goriška | Jugovzhodna Slovenija | Koroška | Notranjsko-kraška | Obalno-kraška | Osrednjeslovenska | Podravska | Pomurska | Savinjska | ||
|---|---|---|---|---|---|---|---|---|---|---|---|
| forest | % | 69 | 69 | 71 | 72 | 72 | 60 | 60 | 42 | 33 | 58 |
| plantations | % | 1 | 3 | 2 | 2 | 1 | 6 | 1 | 5 | 4 | 4 |
| arable land | % | 4 | 1 | 6 | 2 | 1 | 2 | 7 | 22 | 42 | 6 |
| built-up land | % | 4 | 3 | 4 | 4 | 2 | 7 | 8 | 8 | 7 | 6 |
| grassland | % | 14 | 14 | 16 | 18 | 21 | 19 | 21 | 19 | 11 | 24 |
| water | % | 1 | 0 | 0 | 1 | 0 | 0 | 0 | 1 | 1 | 1 |
| reforestation | % | 1 | 3 | 1 | 1 | 2 | 6 | 1 | 2 | 2 | 1 |
| other | % | 6 | 6 | 0 | 0 | 0 | 1 | 1 | 1 | 1 | 1 |
| Spodnjeposavska | Zasavska | Slovenia | |||||||||
| forest | % | 50 | 65 | 61 | |||||||
| plantations | % | 5 | 2 | 3 | |||||||
| arable land | % | 13 | 1 | 9 | |||||||
| built-up land | % | 6 | 7 | 5 | |||||||
| grassland | % | 22 | 22 | 18 | |||||||
| water | % | 1 | 0 | 1 | |||||||
| reforestation | % | 2 | 1 | 2 | |||||||
| other | % | 1 | 1 | 2 |
Record of the use of agricultural and forest land 2008 and 2012. Ministry of Agriculture and Environment, 2012.
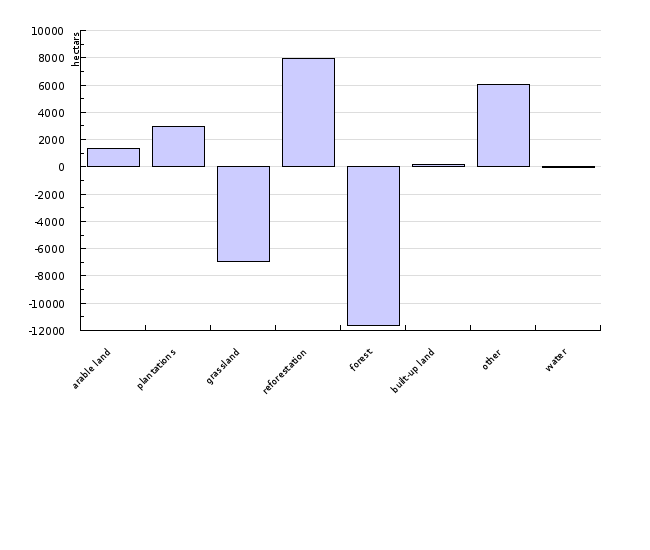
| arable land | plantations | grassland | reforestation | forest | built-up land | other | water | ||
|---|---|---|---|---|---|---|---|---|---|
| Net land cover change 2008-2012 | hectars | 1356 | 2981 | -6923 | 7954 | -11609 | 202 | 6053 | -13 |
| Share of land cover change 2008-2012 | % | 1 | 5 | -2 | 22 | -1 | 0 | 16 | -0 |
Record of the use of agricultural and forest land 2008 and 2012. Ministry of Agriculture and Environment, 2012.
| arable land | plantations | grassland | reforestation | forest | built-up land | other | water | ||
|---|---|---|---|---|---|---|---|---|---|
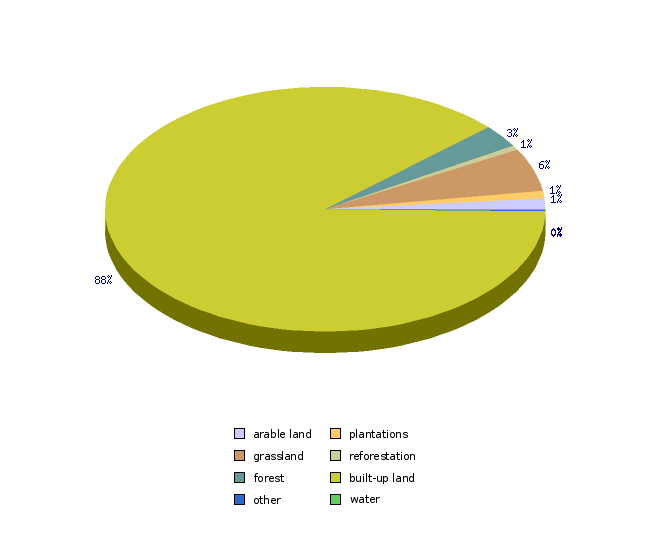
| Built-up land in 2012 according to land use in 2008 | hectars | 1550.5 | 1069.9 | 6208.1 | 633.4 | 3274.2 | 96138.1 | 116.4 | 172.4 |
| Built-up land in 2012 according to land use in 2008 | % | 1.4 | 1 | 5.7 | 0.6 | 3 | 88.1 | 0.1 | 0.2 |
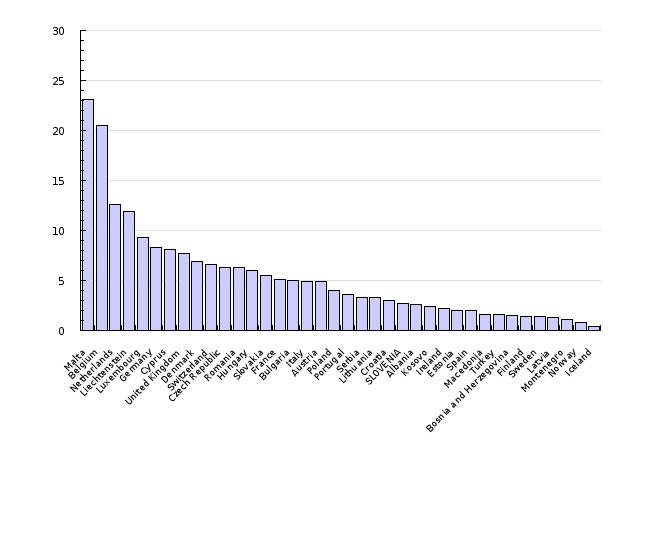
CORINE LAND COVER 2006, Land accounts data viewer 1990, 2000, 2006, EEA 2012
| Malta | Belgium | Netherlands | Liechtenstein | Luxembourg | Germany | Cyprus | United Kingdom | Denmark | Switzerland | ||
|---|---|---|---|---|---|---|---|---|---|---|---|
| Artificial surfaces | % | 23.1 | 20.5 | 12.6 | 11.9 | 9.3 | 8.3 | 8.1 | 7.7 | 6.9 | 6.6 |
| Czech Republic | Romania | Hungary | Slovakia | France | Bulgaria | Italy | Austria | Poland | Portugal | ||
| Artificial surfaces | % | 6.3 | 6.3 | 6 | 5.5 | 5.1 | 5 | 4.9 | 4.9 | 4 | 3.6 |
| Serbia | Lithuania | Croatia | SLOVENIA | Albania | Kosovo | Ireland | Estonia | Spain | Macedonia | ||
| Artificial surfaces | % | 3.3 | 3.3 | 3 | 2.7 | 2.6 | 2.4 | 2.2 | 2 | 2 | 1.6 |
| Turkey | Bosnia and Herzegovina | Finland | Sweden | Latvia | Montenegro | Norway | Iceland | ||||
| Artificial surfaces | % | 1.6 | 1.5 | 1.4 | 1.4 | 1.3 | 1.1 | 0.8 | 0.4 |
Goals
• Rational and efficient spatial development; ensuring rational land use, reversal of negative land use trends;
• Rational use of natural resources. Efficient and multi-purpose use of land and resources, rational use of land for urbanisation and controlled expansion of urban areas. Preservation of production potential of land for agricultural use;
• Promotion of preservation and development of cultural diversity as a basis for national spatial identity of high quality;
• Promotion of preservation of biodiversity, natural values and natural processes;
• Preservation and improvement of production potential and increase in the area of agricultural land for food production;
• Sustainable management of fertile land;
• Landscape preservation, preservation and development of rural areas;
• As economic and certain social activities greatly affect the level of nature preservation through exploitation of natural resources and developments, preservation and sustainable use of biodiversity components and natural values must be connected and integrated into relevant sectoral and inter-sectoral plans;
• Adoption of policies directed toward the goal of no net land take by 2050. Countries must better integrate direct and indirect land use and its impact on the environment in decision-making and limit land exploitation and land take to the maximum extent possible.
Comment
In 2012, there were 109,162.8 hectares of built-up areas in Slovenia according to data provided by the Ministry of Agriculture, Forestry and Food. This would mean only 202.2 ha of newly built-up areas compared to the situation in 2008. However, such interpretation of land use data is inappropriate. We analysed the deficiencies of these data in further detail in the report Razvoj kazalcev okolja v Sloveniji – Površje (Development of environmental indicators in Slovenia – Land) (Lampič, Repe, 2012). The analysis, in which all land use categories were overlapped, showed that the total area of newly built-up land in both years, 2008 and 2012, was only 96,138.1 ha (which represents 88.1% of built-up areas in 2008). The remaining 12% (slightly over 13,000 ha) of land, according to the recorded land use in 2008, appears in other land use categories. In this event, as much as 13,024 hectares of land was built-up in a four-year period; however, we have to point out that this number does not reflect the actual situation. The largest areas of newly built-up land occur within the categories of grassland (6,208.1 ha), forest (3,274.2 ha) and arable fields (1,550.5 ha). This interpretation would mean that as much as 8.9 ha of land was built-up every day in this four-year period.
Considering all the land use changes in Slovenia in recent years, we know that the total area of built-up land probably increased by more than 202 ha (this would mean only 0.14 ha per day over the last four years), unlike the calculations by land use category would suggest. The overlapping of land use category also doesn’t give us a realistic picture. Photo interpretation of land use from digital orthophoto images, which is the basis for establishing the actual use of agricultural and forest land (Ministry of Agriculture, Forestry and Food) has been improving and upgrading from year to year. In total, the area of built-up land did not increase by 13,024 ha as the results of overlapping of land use categories would suggest. However, there is no doubt that the greatest increase in the area of built-up land occurred on agricultural land. Unfortunately, it is impossible to give the precise area of land take in this four-year period. The following data points to methodological inconsistency: 702 of arable fields, 2,670 of permanent crops, 6,574 ha of grassland, 1,603 ha of forest, etc. as recorded in 2012 fell under the category of built-up land in 2008. This points to a gap in the interpretation of orthophoto images; however, it is impossible to estimate the actual error more precisely.
As regards the percentage of built-up areas at the level of statistical regions of Slovenia, the Podravje and Central Slovenia regions stand out. In these two regions, built-up areas represent more than 8% of their land area. The percentage of built-up areas is lowest in the sparsely populated and heavily forested Notranjska-Kras region (2.4%).
When it comes to Slovenia, the loss of agricultural land, and arable land in particular, is the most critical. Agricultural land, especially arable fields, covers a very modest percentage of land area in Slovenia. Among the 38 EEA countries, Slovenia has one of the lowest percentages of agricultural land in the land use structure (less than 35%), while the area of arable fields per capita is even less favourable. According to CLC data from 2006, only six countries have a lower percentage of agricultural land (Estonia, Switzerland, Albania, Liechtenstein, Sweden, Finland, Norway and Iceland), while in some countries, e.g. Denmark, Hungary, Ireland and Poland, this percentage exceeds 60%.
Inefficient as well as environmentally and spatially unsustainable land use in the past has already caused great changes in land cover and the use of agricultural land. Therefore, efforts to halt the increasing area of built-up land are urgent (The Roadmap to a Resource Efficient Europe, COM [2011]), as well as the push for efficient agricultural land management and, in particular, more rational land use through directing the development of new activities to previously degraded, less valuable land, thus protecting agricultural land. Halting the expansion of built-up land is essential for sustainable land management and efficient management of agricultural land in Slovenia. It is important to entirely stop the expansion of various human activities on high-quality agricultural land (arable fields, gardens), which is also decisive in ensuring an appropriate food self-sufficiency level.


