[ZD03] Exposure of children to polluted air due to particulate matter PM10

Key message

Children in Slovenia are exposed to concentrations of 30–40 µg PM10/m3, which is above the level recommended by the World Health Organization. The number of admissions to hospital of children diagnosed with respiratory diseases accounts for 15% of all admissions (Institute of Public Health of the Republic of Slovenia, 2009). The Zasavje region stands out with the concentration levels that are among the highest in Slovenia.
Definition
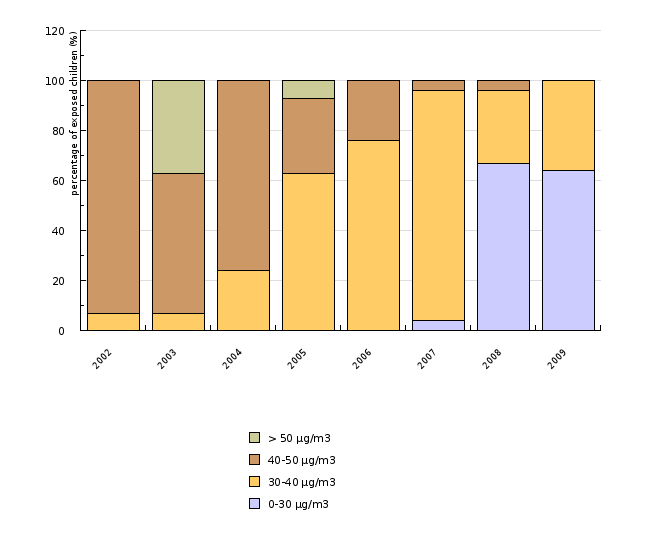
The indicator shows the exposure of children to polluted air due to particulate matter PM10 in the period 2002–2007. A sample group of children aged between 0 and 15 years was examined in the study. Exposure to PM10 is shown in the indicator for various groups of PM10 concentration levels, from 0–30 µg/m3, 30–40 µg/m3, 40–50 µg/m3 and <50 µg/m3. The proportion of children exposed to individual groups of PM10 concentration levels was calculated for Ljubljana, Maribor, Celje, Murska Sobota, Nova Gorica, Trbovlje and Zagorje ob Savi. In the calculation of the proportion of children in individual groups of PM10 concentration levels, the total number of children in a city/town is taken into consideration. The classification of a measurement site by PM10 total concentration level was done on the basis of measurement results reflecting the annual PM10 concentration level in outdoor air per individual measurement site. PM10 measurements are performed by the Environment Agency of the Republic of Slovenia as part of regular outdoor air quality monitoring.
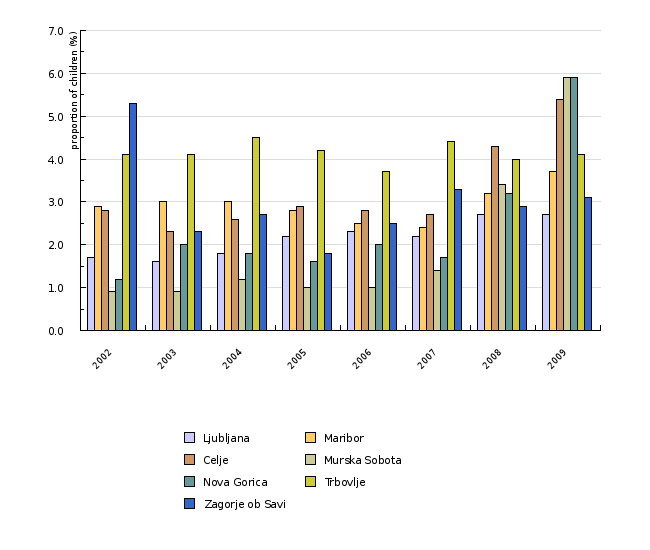
The proportion of children in the 0–15 age group who were admitted to hospital due to a diagnosed respiratory disease is shown for the period 2002–2007. The proportion for a city/town was calculated as the ratio between the number of children who were admitted to hospital due to a diagnosed respiratory disease and the total number of children in this city/town in a given year.
Concentration of PM10 is a good indicator of exposure to dust particles in the outdoor air. A number of epidemiological studies carried out in Europe and elsewhere in the world show a relationship between exposure to PM10 and the health of children as a particularly vulnerable social group (Cohen et al., 2004).
Charts
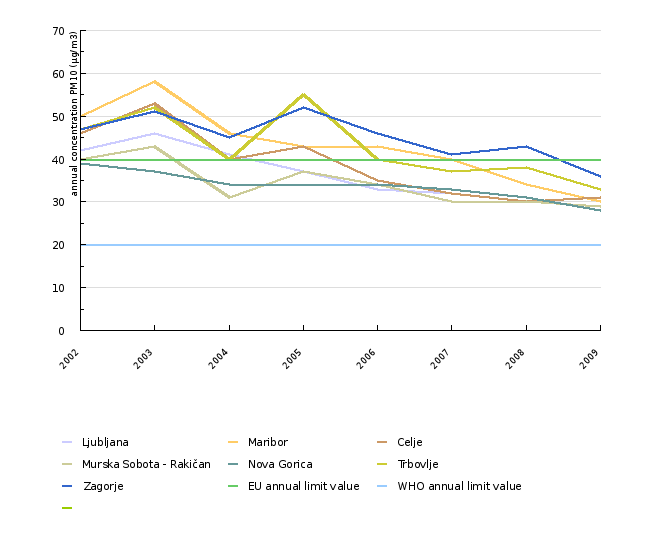
Zbirka podatkov avtomatskih meritev državne mreže za spremljanje kakovosti zraka (DMKZ), Agencija RS za okolje, 2010.
| 2002 | 2003 | 2004 | 2005 | 2006 | 2007 | 2008 | 2009 | ||
|---|---|---|---|---|---|---|---|---|---|
| Ljubljana | µg/m3 | 42 | 46 | 41 | 37 | 33 | 32 | 30 | 29 |
| Maribor | µg/m3 | 50 | 58 | 46 | 43 | 43 | 40 | 34 | 30 |
| Celje | µg/m3 | 46 | 53 | 40 | 43 | 35 | 32 | 30 | 31 |
| Murska Sobota - Rakičan | µg/m3 | 40 | 43 | 31 | 37 | 34 | 30 | 30 | 29 |
| Nova Gorica | µg/m3 | 39 | 37 | 34 | 34 | 34 | 33 | 31 | 28 |
| Trbovlje | µg/m3 | 47 | 52 | 40 | 55 | 40 | 37 | 38 | 33 |
| Zagorje | µg/m3 | 47 | 51 | 45 | 52 | 46 | 41 | 43 | 36 |
| EU annual limit value | µg/m3 | 40 | 40 | 40 | 40 | 40 | 40 | 40 | 40 |
| WHO annual limit value | µg/m3 | 20 | 20 | 20 | 20 | 20 | 20 | 20 | 20 |
Baza podatkov IVZ RS, Inštitut za varovanje zdravja RS, 2010 in Zbirka podatkov avtomatskih meritev državne mreže za spremljanje kakovosti zraka (DMKZ), Agencija RS za okolje, 2010.
| 2002 | 2003 | 2004 | 2005 | 2006 | 2007 | 2008 | 2009 | ||
|---|---|---|---|---|---|---|---|---|---|
| 0-30 µg/m3 | % | 0 | 0 | 0 | 0 | 0 | 4 | 67 | 64 |
| 30-40 µg/m3 | % | 7 | 7 | 24 | 63 | 76 | 92 | 29 | 36 |
| 40-50 µg/m3 | % | 93 | 56 | 76 | 30 | 24 | 4 | 4 | 0 |
| > 50 µg/m3 | % | 0 | 37 | 0 | 7 | 0 | 0 | 0 | 0 |
Baza podatkov IVZ RS, Inštitut za varovanje zdravja, 2010.
| 2002 | 2003 | 2004 | 2005 | 2006 | 2007 | 2008 | 2009 | ||
|---|---|---|---|---|---|---|---|---|---|
| Ljubljana - children admitted to hospital | No. | 786 | 706 | 805 | 961 | 1020 | 973 | 1017 | 1055 |
| Maribor - children admitted to hospital | No. | 544 | 546 | 526 | 496 | 433 | 426 | 441 | 496 |
| Celje - children admitted to hospital | No. | 255 | 196 | 223 | 249 | 237 | 229 | 293 | 371 |
| Murska Sobota - children admitted to hospital | No. | 78 | 73 | 96 | 81 | 77 | 104 | 89 | 156 |
| Nova Gorica - children admitted to hospital | No. | 95 | 154 | 137 | 119 | 149 | 131 | 144 | 176 |
| Trbovlje - children admitted to hospital | No. | 97 | 91 | 79 | 88 | 77 | 90 | 88 | 90 |
| Zagorje ob Savi - children admitted to hospital | No. | 142 | 59 | 67 | 45 | 62 | 80 | 76 | 80 |
| Ljubljana - children in the municipality | No. | 46046 | 45044 | 44506 | 44416 | 44330 | 44498 | 37610 | 38397 |
| Maribor - children in the municipality | No. | 18487 | 18017 | 17660 | 17530 | 17338 | 17722 | 13571 | 13565 |
| Celje - children in the municipality | No. | 8961 | 8681 | 8624 | 8538 | 8497 | 8534 | 6803 | 6818 |
| Murska Sobota - children in the municipality | No. | 8443 | 8204 | 8039 | 7908 | 7787 | 7685 | 2607 | 2629 |
| Nova Gorica - children in the municipality | No. | 7925 | 7709 | 7600 | 7582 | 7500 | 7515 | 4472 | 4489 |
| Trbovlje - children in the municipality | No. | 2356 | 2245 | 2167 | 2107 | 2068 | 2057 | 2188 | 2194 |
| Zagorje ob Savi - children in the municipality | No. | 2664 | 2605 | 2501 | 2476 | 2447 | 2443 | 2628 | 2620 |
| Ljubljana | % | 1.7 | 1.6 | 1.8 | 2.2 | 2.3 | 2.2 | 2.7 | 2.7 |
| Maribor | % | 2.9 | 3 | 3 | 2.8 | 2.5 | 2.4 | 3.2 | 3.7 |
| Celje | % | 2.8 | 2.3 | 2.6 | 2.9 | 2.8 | 2.7 | 4.3 | 5.4 |
| Murska Sobota | % | 0.9 | 0.9 | 1.2 | 1 | 1 | 1.4 | 3.4 | 5.9 |
| Nova Gorica | % | 1.2 | 2 | 1.8 | 1.6 | 2 | 1.7 | 3.2 | 5.9 |
| Trbovlje | % | 4.1 | 4.1 | 4.5 | 4.2 | 3.7 | 4.4 | 4 | 4.1 |
| Zagorje ob Savi | % | 5.3 | 2.3 | 2.7 | 1.8 | 2.5 | 3.3 | 2.9 | 3.1 |
The European Environment and Health Information System (ENHIS), 2007.
| Finland | Ireland | Sweden | Lithuania | Iceland | France | Norway | Estonia | United Kingdom | Switzerland | ||
|---|---|---|---|---|---|---|---|---|---|---|---|
| PM10 | No. of exposed children | 321416 | 429335 | 24323 | |||||||
| PM10 | No. of exposed children | 978551 | 1141178 | 1455002 | 14200 | 6853532 | 135879 | 2199233 | |||
| PM10 | No. of exposed children | 499510 | 590100 | 160594 | 18274949 | 808602 | 434763 | 24327040 | 1770190 | ||
| PM10 | No. of exposed children | 113527 | |||||||||
| PM10 | No. of exposed children | ||||||||||
| PM10 | No. of exposed children | ||||||||||
| PM10 = 60-80 µg/m3 | No. of exposed children | ||||||||||
| population covered | No. of exposed children | 1299967 | 1141178 | 1954512 | 604300 | 160594 | 25557816 | 968804 | 434763 | 26526273 | 1883717 |
| PM10 | % of exposed children | 24.7 | 0 | 0 | 0 | 0 | 1.7 | 2.5 | 0 | 0 | 0 |
| PM10 | % of exposed children | 75.3 | 100 | 74.4 | 2.3 | 0 | 26.8 | 14 | 0 | 8.3 | 0 |
| PM10 | % of exposed children | 0 | 0 | 25.6 | 97.7 | 100 | 71.5 | 83.5 | 100 | 91.7 | 94 |
| PM10 | % of exposed children | 0 | 0 | 0 | 0 | 0 | 0 | 0 | 0 | 0 | 6 |
| PM10 | % of exposed children | 0 | 0 | 0 | 0 | 0 | 0 | 0 | 0 | 0 | 0 |
| PM10 | % of exposed children | 0 | 0 | 0 | 0 | 0 | 0 | 0 | 0 | 0 | 0 |
| PM10 = 60-80 µg/m3 | % of exposed children | 0 | 0 | 0 | 0 | 0 | 0 | 0 | 0 | 0 | 0 |
| annual mean PM10 | µg/m3 | 15.8 | 15.8 | 20 | 20.2 | 20.3 | 21.1 | 22.4 | 22.7 | 24.6 | 25.3 |
| Germany | Denmark | Austria | Portugal | Netherlands | Spain | Slovenia | Slovakia | Belgium | Greece | ||
| PM10 | No. of exposed children | ||||||||||
| PM10 | No. of exposed children | 812393 | 606072 | ||||||||
| PM10 | No. of exposed children | 19302917 | 1694590 | 2123025 | 381057 | 552149 | 4381386 | 27113 | 749664 | 1262753 | |
| PM10 | No. of exposed children | 3666201 | 676045 | 784820 | 1451944 | 2130238 | 365779 | 260557 | 1425067 | 3821970 | |
| PM10 | No. of exposed children | 2916927 | 147457 | ||||||||
| PM10 | No. of exposed children | 54405 | 285763 | ||||||||
| PM10 = 60-80 µg/m3 | No. of exposed children | 30664 | |||||||||
| population covered | No. of exposed children | 23781511 | 1694590 | 2799070 | 1165877 | 2004093 | 10034623 | 392892 | 1242747 | 2973583 | 3821970 |
| PM10 | % of exposed children | 0 | 0 | 0 | 0 | 0 | 0 | 0 | 0 | 0 | 0 |
| PM10 | % of exposed children | 3.4 | 0 | 0 | 0 | 0 | 6 | 0 | 0 | 0 | 0 |
| PM10 | % of exposed children | 81.2 | 100 | 75.8 | 32.7 | 27.6 | 43.7 | 6.9 | 60.3 | 42.5 | 0 |
| PM10 | % of exposed children | 15.4 | 0 | 24.2 | 67.3 | 72.4 | 21.2 | 93.1 | 21 | 47.9 | 100 |
| PM10 | % of exposed children | 0 | 0 | 0 | 0 | 0 | 29.1 | 0 | 11.9 | 0 | 0 |
| PM10 | % of exposed children | 0 | 0 | 0 | 0 | 0 | 0 | 0 | 4.4 | 9.6 | 0 |
| PM10 = 60-80 µg/m3 | % of exposed children | 0 | 0 | 0 | 0 | 0 | 0 | 0 | 2.5 | 0 | 0 |
| annual mean PM10 | µg/m3 | 25.8 | 27.1 | 30 | 30.2 | 32.1 | 33 | 33.1 | 33.8 | 34.1 | 36 |
| Czech Republic | Hungary | Italy | Poland | Serbia | Bulgaria | Romania | |||||
| PM10 | No. of exposed children | 32549 | |||||||||
| PM10 | No. of exposed children | 96625 | 142335 | 17300 | |||||||
| PM10 | No. of exposed children | 459832 | 66340 | 5265867 | 801600 | 199869 | 73586 | ||||
| PM10 | No. of exposed children | 2253762 | 2189407 | 4126697 | 5949600 | 47412 | |||||
| PM10 | No. of exposed children | 936362 | 1010278 | 2829600 | 1168454 | 224644 | |||||
| PM10 | No. of exposed children | 191285 | 3629602 | 815800 | 2361610 | ||||||
| PM10 = 60-80 µg/m3 | No. of exposed children | 28243 | 1384092 | 1248600 | 399212 | ||||||
| population covered | No. of exposed children | 3902033 | 2352372 | 15558871 | 11662500 | 1168454 | 871137 | 2435196 | |||
| PM10 | % of exposed children | 0.8 | 0 | 0 | 0 | 0 | 0 | 0 | |||
| PM10 | % of exposed children | 0 | 4.1 | 0.9 | 0.1 | 0 | 0 | 0 | |||
| PM10 | % of exposed children | 11.8 | 2.8 | 33.8 | 6.9 | 0 | 22.9 | 3 | |||
| PM10 | % of exposed children | 57.8 | 93.1 | 26.5 | 51 | 0 | 5.4 | 0 | |||
| PM10 | % of exposed children | 24 | 0 | 6.5 | 24.3 | 100 | 25.8 | 0 | |||
| PM10 | % of exposed children | 4.9 | 0 | 23.3 | 7 | 0 | 0 | 97 | |||
| PM10 = 60-80 µg/m3 | % of exposed children | 0.7 | 0 | 8.9 | 10.7 | 0 | 45.8 | 0 | |||
| annual mean PM10 | µg/m3 | 36.7 | 36.9 | 39.4 | 41.7 | 47.1 | 49.9 | 51.9 |
EUROSTAT, Urban population exposure to air pollution by particulate matter, 2010.
| year | Estonia | Ireland | Finland | Lithuania | Sweden | Norway | United Kingdom | Germany | Denmark | Austria | |
|---|---|---|---|---|---|---|---|---|---|---|---|
| 1999 | µg/m3 | np | 15.8 | 15.7 | np | 14.1 | np | 24.2 | 27.7 | np | : |
| 2000 | µg/m3 | np | np | 14.7 | np | 17 | np | 23.4 | 27 | np | 25.9 |
| 2001 | µg/m3 | 18.2 | 20.4 | 16.4 | np | 17.9 | np | 24.2 | 24.9 | np | 32 |
| 2002 | µg/m3 | 21.3 | 19 | 16.9 | np | 19.5 | np | 23.2 | 26.6 | 23.9 | 26.1 |
| 2003 | µg/m3 | 19.4 | 18.6 | 16.3 | np | 19.6 | 19.6 | 25.8 | 29 | 24.6 | 32.2 |
| 2004 | µg/m3 | 17.6 | 14.4 | 13.9 | 23.3 | 18.2 | 17.3 | 22.6 | 23.7 | 19.5 | 25.2 |
| 2005 | µg/m3 | 20.7 | 15.1 | 15.3 | 22.9 | 19.5 | 24 | 23.5 | 24.2 | 22.8 | 28.9 |
| 2006 | µg/m3 | 22.7 | 16.4 | 16.6 | 20.2 | 20.4 | 22.4 | 24.6 | 25.7 | 26.9 | 30.4 |
| 2007 | µg/m3 | 18.6 | 14.6 | 16.8 | 20.2 | 17.3 | 20.7 | 23.3 | 22.5 | 21 | 23.8 |
| 2008 | µg/m3 | 11.1 | 13.7 | 14.3 | 17.4 | 17.6 | 18.9 | 20.4 | 21.1 | 21.4 | 22.9 |
| year | Latvia | France | Portugal | Slovakia | Netherlands | Belgium | EU-27 | Hungary | Spain | Czech Republic | |
| 1999 | µg/m3 | np | np | 37.6 | 36.5 | 33.1 | 34.5 | 27.9 | np | 33.6 | 28 |
| 2000 | µg/m3 | np | np | 32.4 | 28.5 | 30.1 | 32.9 | 27.7 | np | 33.3 | 32.7 |
| 2001 | µg/m3 | np | 21.9 | 35.7 | 26.7 | 29 | 33.9 | 27.1 | np | 30.6 | 35.6 |
| 2002 | µg/m3 | np | 21.9 | 33.7 | 28.6 | 31.4 | 33.2 | 28.1 | np | 31.2 | 40.2 |
| 2003 | µg/m3 | np | 23.7 | 34.1 | 31.4 | 32.9 | 36.5 | 31.2 | 40.1 | 31.5 | 47 |
| 2004 | µg/m3 | np | 20.8 | 33 | 33.1 | 29.4 | 30.3 | 27.8 | 25.2 | 31.4 | 38.4 |
| 2005 | µg/m3 | np | 20.4 | 34 | 33.2 | 28.5 | 29.6 | 29.2 | 37.7 | 32.9 | 39.6 |
| 2006 | µg/m3 | np | 21.1 | 32 | 28.3 | 31.5 | 30.7 | 30.8 | 35.8 | 34.5 | 40.6 |
| 2007 | µg/m3 | np | 27.3 | 30.4 | 26.3 | 29.6 | 26.3 | 29 | 29.7 | 32.9 | 31.9 |
| 2008 | µg/m3 | 23.8 | 24.1 | 24.3 | 25 | 25.2 | 26 | 26.8 | 27.1 | 27.7 | 29.8 |
| year | Slovenia | Poland | Italy | Greece | Romania | Bulgaria | |||||
| 1999 | µg/m3 | np | 44.1 | np | np | np | np | ||||
| 2000 | µg/m3 | np | 41.8 | 44.4 | np | np | 20.4 | ||||
| 2001 | µg/m3 | np | 37.9 | 31.1 | 40.9 | np | 28.6 | ||||
| 2002 | µg/m3 | 30.9 | 45 | 39.3 | 42.8 | np | np | ||||
| 2003 | µg/m3 | 43.8 | 44.4 | 40.1 | 39.1 | np | 60.7 | ||||
| 2004 | µg/m3 | 40.6 | 35.1 | 39.3 | 40.3 | 53 | 49 | ||||
| 2005 | µg/m3 | 36.4 | 38.9 | 42.9 | 41.1 | 46.2 | 45 | ||||
| 2006 | µg/m3 | 33.3 | 44.6 | 41.5 | 36.1 | 52.2 | 48.9 | ||||
| 2007 | µg/m3 | 32.4 | 34 | 38.8 | 32.3 | 43.1 | 46.8 | ||||
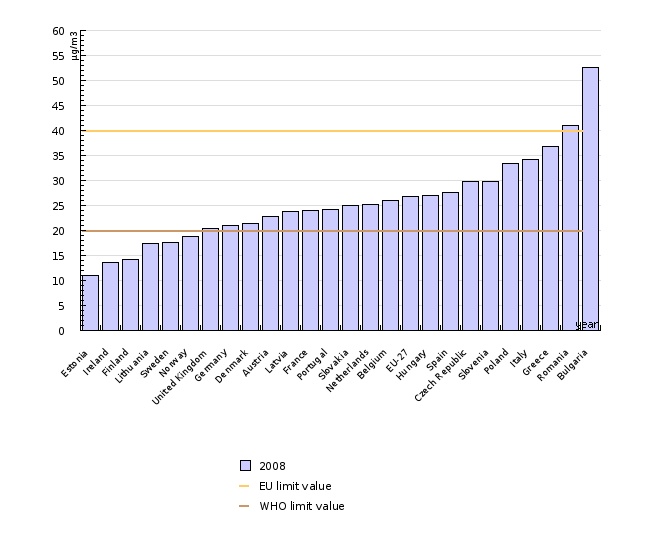
| 2008 | µg/m3 | 29.9 | 33.4 | 34.3 | 36.8 | 41.1 | 52.7 |
Goals
Child health protection and, therefore, protection of the respiratory system is a priority of the EU health policies. Children are highlighted as a particularly vulnerable social group. According to the WHO recommendations, it would be necessary to reduce health risks by ensuring the following annual average concentrations: for PM2.5 10 µg/m3 and for PM10 20 µg/m3 (Hong et al., 2002).
Comment
Dust particles are present in all places occupied by people. Humans generate them with activities such as traffic, energy generation, heating of homes and industry. Dust particles smaller than 10 µm are air pollutants that can penetrate deep into the lungs (Brunekreeft, 2002).
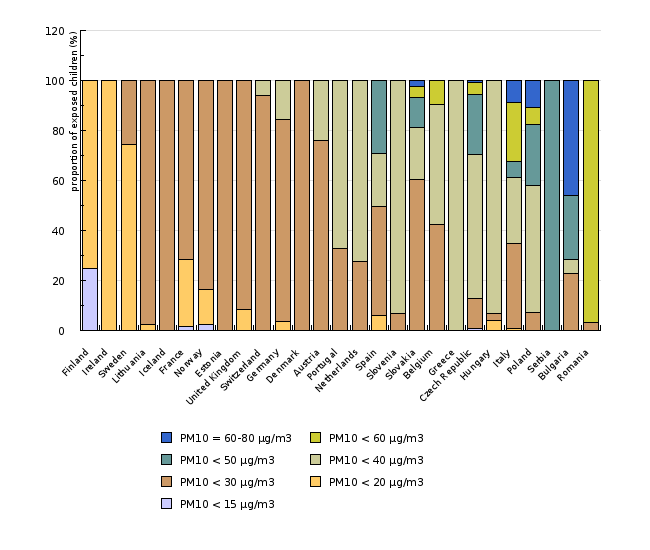
The majority of the inhabitants of European cities (89%) in which PM10 is measured on a regular ongoing basis are exposed to concentrations above the values recommended by the World Health Organization (WHO, 2006). According to WHO, the recommended annual PM10 concentration is 20 µg/m3. This value represents a major health risk for children, since increased concentrations affect the rate of lung function development, aggravate asthma and cause other respiratory symptoms. Long-term exposure to increased PM10 concentrations also increases the mortality rate in adults. The effects of exposure are determined by the PM10 concentration and exposure duration. It is evident from Figure ZD3-4 – representing the percentage of children exposed to PM10 polluted air and living in selected European cities – that the number of exposed children in these cities is higher than in some Eastern and South Eastern European countries. Geographic characteristics and measures adopted by individual countries and cities in order to reduce pollution have an impact on the number of children exposed.
Although no relationship between long-term exposure to air pollution and an increased incidence of asthma in children was examined in older studies, recent research indeed shows a relationship between long-term exposure to PM10 polluted air and higher asthma morbidity. On the basis of data from 1990, the World Health Organization came to the conclusion that, in Europe, around 700 deaths of children aged between 0 and 4 years might have been caused by an acute respiratory disease attributable to PM10 exposure (Cohen et al., 2004). The measurement of the effects of PM10 exposure on morbidity is more complex and less accurate; however, previous WHO analyses show that by reducing the concentration of PM10 to 20 µg/m3, the incidence of coughs and lower airway disease could be reduced by 7%, and hospital admissions due to respiratory diseases in children under 15 years by 2% per year (WHO, 2005).
Figure ZD3-1 shows that, in Slovenia, children aged between 0 and 15 years are, on average, exposed to PM10 concentrations ranging between 30 and 40 µg/m3. Zasavje (exactly Zagorje ob Savi) should be highlighted in this context as a region where annual PM10 concentration in 2008 still exceeded both - the recommended value (20 µg/m3) and the prescribed limit value (40 µg/m3). Figure ZD3-2 shows that annual PM10 concentrations at all measurement sites in Slovenia have a tendency to range above the value recommended by the World Health Organization (20 µg/m3). The data in Figure ZD3-3 show that, in the period 2002–2007, most children aged between 0 and 15 admitted to hospital due to respiratory diseases were indeed from the Zasavje region, a region where PM10 concentrations are among the highest in Slovenia.
The number of hospital admissions due to respiratory diseases of children aged between 0 and 15 years accounts for a good 15% of all hospital admissions of children in Slovenia. This number would be much higher in case these children were not so well looked after by paediatricians. According to the WHO calculation, the number of hospital admissions due to respiratory diseases of children aged between 0 and 15 years would decrease by around 200 if the average annual PM10 concentration in Slovenia were 20 µg/m3 (or less). A reduction of the concentration of particulate matter (PM10) by 10 µg/m3 would reduce the time children aged between 5 and 14 years of age suffer from diseases of the lower respiratory tract (wheezing, chest pain, shortness of breath, cough) by 1.9 days/year/child. The introduction of new and effective therapies has contributed considerably to a reduction of hospital admissions of patients with severe asthma. It has also been foreseen that the use of bronchodilators would decrease by 18% per year in children with asthma, aged between 5 and 14 years.
Long-term exposure to PM10 increases the risks of mortality and morbidity on account of lung disease and cardiovascular disease. The risk of mortality begins as early as in one's youth. Long-term exposure to dust particles increases by 0.5% for each increase of the average annual concentration of particles by 10 µg/m3. In designating a safe and acceptable risk limit in respect of particles smaller than 2.5 µm, the authors believe that the average annual concentration should not exceed 13 µg/m3. The risk increases above this value. In order to decrease health risks, we therefore propose that an average annual value of 10 µg/m3 for PM2.5 and 20 µg/m3 for PM10 be ensured (Hong et al., 2002).
Methodology
Data for Slovenia
Data – environmental
Objectives summarized by: Children's Environment and Health Action Plan for Europe - CEHAPE (June 2004), WHO Air quality guidelines for particulate matter, ozone, nitrogen dioxide and sulfur dioxide (Global update 2005)
Source database or source: Data for Slovenia have been taken from the National Automatic Measurement Air Quality Network Database (DMKZ) of the Hydrology and State of the Environment Office, Environment Agency of the Republic of Slovenia.
Data administrator: Environment Agency of the Republic of Slovenia
Data acquisition date for this indicator: 9 June 2009
Methodology and frequency of data collection for the indicator: The data cover the period from 2002 to 2007. There is an hourly database containing current data at the disposal of the Environment Agency of the Republic of Slovenia. Annual data for the past year will be available to the public in the first half of next year.
Data processing methodology: The data on PM10 concentrations in outdoor air are weighted by a correction factor designated by the Environment Agency of the Republic of Slovenia and comparable to the data on PM10 in outdoor air of other countries.
Information concerning data quality:
- Advantages and disadvantages of the indicator: Officially reported data were used to calculate the indicator.
- Relevance, accuracy, robustness, uncertainty:
Reliability of the indicator (archival data): Reliable
Uncertainty of the indicator (scenarios/projections): Projections have not been elaborated
- Overall assessment (1 = no major comments, 3 = data to be considered with reservation):
Relevance: 1
Accuracy: 1
Completeness over time: 1
Completeness over space: 1
Data – health
Data for Slovenia
Objectives summarized by: Children's Environment and Health Action Plan for Europe - CEHAPE (June 2004), WHO Air quality guidelines for particulate matter, ozone, nitrogen dioxide and sulfur dioxide (Global update 2005)
Source database or source: Official data were used on the number of admissions to hospital due to respiratory diseases, as incorporated in the database of the Institute of Public Health of the Republic of Slovenia.
Data administrator: Institute of Public Health of the Republic of Slovenia
Data acquisition date for this indicator: 9 June 2009
Methodology and frequency of data collection for the indicator: The data cover the period from 2002 to 2007 and are collected on an annual basis.
Data processing methodology: For transparency purposes, the data on the number of admissions to hospital due to respiratory diseases are presented as proportions.
Information concerning data quality:
- Advantages and disadvantages of the indicator: Officially reported data were used to calculate the indicator.
- Relevance, accuracy, robustness, uncertainty:
Reliability of the indicator (archival data): Reliable
Uncertainty of the indicator (scenarios/projections): Projections have not been elaborated.
- Overall assessment (1 = no major comments, 3 = data to be considered with reservation):
Relevance: 1
Accuracy: 1
Completeness over time: 1
Completeness over space: 1
Data for Europe
Data on PM10 concentrations in outdoor air were acquired from national and local air quality monitoring networks, and data on the number of children by Eurostat.
Source database or source: AirBase: public air quality database
Data administrator: EEA, European Environment Agency, Eurostat
Data acquisition date for the indicator: 2004–2006
Methodology and frequency of data acquisition for the indicator: Data are collected on an annual basis.
Data processing methodology: Average annual concentrations of particulate matter in outdoor air and the number of children living in the area surrounding the selected station were used. On the basis of these data, proportions of children living in areas exposed to PM10 polluted air were calculated.
Information concerning data quality:
- Advantages and disadvantages of the indicator: Data acquisition on a small sample
- Relevance, accuracy, robustness, uncertainty:
Reliability of the indicator (archival data): Reliable
Uncertainty of the indicator (scenarios/projections): No projections
- Overall assessment (1 = no major comments, 3 = data to be considered with reservation):
Relevance: 1
Accuracy: 1
Completeness over time: 1
Completeness over space: 1
Other sources and literature:
- Air Quality Guidelines. Global update 2005. Particulate matter, ozone, nitrogen dioxide and sulfur dioxide. WHO, 2006.
- Bert Brunekreeft. Air pollution and health. The Lancet, vol 360, october 2002 1233 – 1242.
- Cohen AJ et al. Urban air pollution. In: Ezzati M et al, eds. Comparative quantification of health risks. Vol.2. Geneva, World Health Organization, 2004:1353-1433 (7 March 2007).
- ENHIS, 2007. Exposure of children to air pollution (particulate matter) in outdoor air. World Health Organization, Europe.
- Hong YC et al. Air pollution: a new risk factor in ischemic stroke mortality. Stroke, 2002, 110: 221- 228.
- Implementing environment and health information system in Europe. WHO European Centre for Environment and Health. Copenhagen, WHO Regional Office for Europe, 2005. (7 March 2007).


