[VD03] River balance

Key message

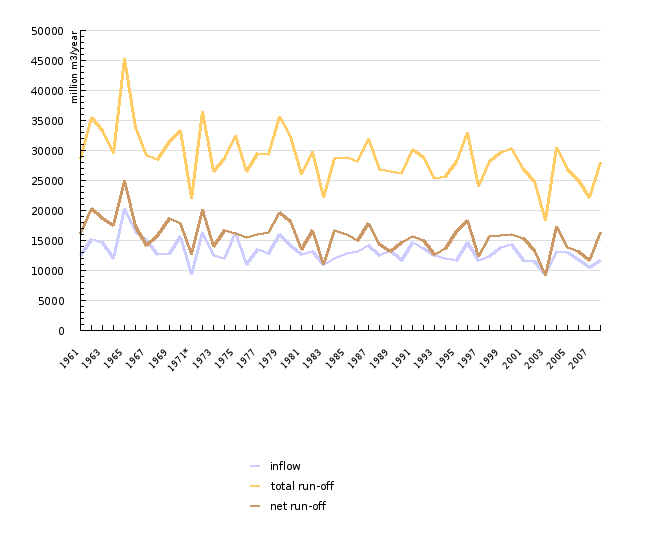
A longer temporal string of comparable data (from 1961 to 2008) indicates the decreasing run-off of river water in Slovenia.
Definition
This indicator shows the annual river balance of the Republic of Slovenia as a whole. The balance is composed of the river water inflow and run-off expressed in million m3/year. Both elements are calculated on the basis of mean annual discharge (flow, Qs) of the water measuring stations catching the majority of inflow and run-off of river water in and from Slovenia. The balance of the river flow rates in Slovenia represents one of the fundamental and more dynamic elements of the Slovenian water balance which is also composed of precipitation, evaporation, changes in groundwater reserves and water use. Discharge measurements are reliable and have a certain tradition, so that a longer temporal frame of comparable data is available for them. Upon accurate assessment of immediate anthropogenic effects on the river regime, the river balance may serve as a good indicator for the assessment of (potential) effects of climate changes on the quantities of available water.
Charts
Hidrolog - Hydrology Database, Environmental Agency of the Republic of Slovenia, 2010; (* Data changed, more in Methodology chapter).
| 1961 | 1962 | 1963 | 1964 | 1965 | 1966 | 1967 | 1968 | 1969 | 1970 | ||
|---|---|---|---|---|---|---|---|---|---|---|---|
| inflow | million m3/year | 12453 | 15163 | 14629 | 11969 | 20300 | 16564 | 14929 | 12715 | 12858 | 15595 |
| total run-off | million m3/year | 28699 | 35475 | 33294 | 29531 | 45265 | 33854 | 29115 | 28472 | 31449 | 33382 |
| net run-off | million m3/year | 16246 | 20312 | 18665 | 17562 | 24965 | 17290 | 14186 | 15757 | 18591 | 17787 |
| 1971* | 1972 | 1973 | 1974 | 1975 | 1976 | 1977 | 1978 | 1979 | 1980 | ||
| inflow | million m3/year | 9408 | 16409 | 12512 | 12081 | 16325 | 11028 | 13551 | 12898 | 16075 | 14103 |
| total run-off | million m3/year | 22074 | 36552 | 26541 | 28743 | 32543 | 26566 | 29571 | 29262 | 35669 | 32300 |
| net run-off | million m3/year | 12666 | 20143 | 14029 | 16662 | 16218 | 15538 | 16020 | 16364 | 19594 | 18197 |
| 1981 | 1982 | 1983 | 1984 | 1985 | 1986 | 1987 | 1988 | 1989 | 1990 | ||
| inflow | million m3/year | 12652 | 13152 | 11069 | 11965 | 12754 | 13098 | 14189 | 12499 | 13414 | 11602 |
| total run-off | million m3/year | 26077 | 29880 | 22087 | 28633 | 28763 | 28177 | 31944 | 26871 | 26557 | 26188 |
| net run-off | million m3/year | 13425 | 16728 | 11018 | 16668 | 16009 | 15079 | 17755 | 14372 | 13143 | 14586 |
| 1991 | 1992 | 1993 | 1994 | 1995 | 1996 | 1997 | 1998 | 1999 | 2000 | ||
| inflow | million m3/year | 14611 | 13736 | 12566 | 12033 | 11746 | 14737 | 11706 | 12344 | 13873 | 14299 |
| total run-off | million m3/year | 30235 | 28802 | 25296 | 25725 | 28176 | 32994 | 24027 | 28092 | 29659 | 30263 |
| net run-off | million m3/year | 15624 | 15066 | 12730 | 13692 | 16430 | 18257 | 12321 | 15748 | 15786 | 15964 |
| 2001 | 2002 | 2003 | 2004 | 2005 | 2006 | 2007 | 2008 | ||||
| inflow | million m3/year | 11586 | 11458 | 9253 | 13087 | 12938 | 11821 | 10550 | 11639 | ||
| total run-off | million m3/year | 26912 | 24785 | 18353 | 30492 | 26837 | 24967 | 22213 | 28043 | ||
| net run-off | million m3/year | 15326 | 13327 | 9100 | 17405 | 13899 | 13146 | 11663 | 16404 |
Goals
- Good water status by the year 2015.
- Improved assessments of water quantities.
- Providing sufficient amount of drinking water for inhabitants.
- Better availability of water intended for use (in the sense of reducing the effects of hydrological droughts) and improved state of water and water ecosystems.


