[EN18] Renewable Energy
[EN18] Renewable Energy

Definition
Charts
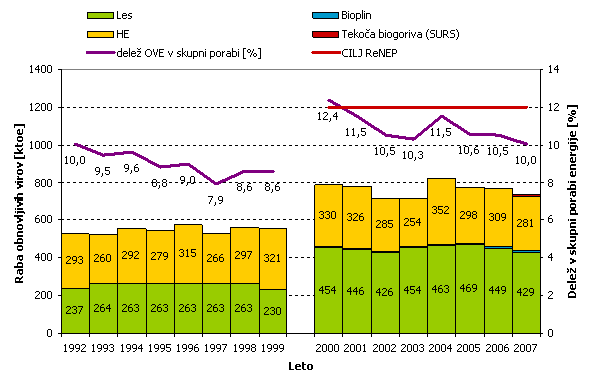
Figure EN18-1: Missing title
Sources:
Statistical Office of the Republic of Slovenia, 2008; Jozef Stefan Institute, 2008.
| 1992 | 1993 | 1994 | 1995 | 1996 | 1997 | 1998 | 1999 | 2000 | 2001 | ||
|---|---|---|---|---|---|---|---|---|---|---|---|
| Wood & Wood Waste | [ktoe] | 236.7 | 264.3 | 263.2 | 262.9 | 262.7 | 262.6 | 262.8 | 230.2 | 454.3 | |
| Biogas | [ktoe] | 0 | 0 | 0 | 0 | 0 | 0 | 0 | 3.7 | 3.6 | |
| Hydro Power | [ktoe] | 293 | 260 | 292 | 279 | 316 | 266 | 297 | 322 | 330 | |
| Geothermal Energy | [ktoe] | ||||||||||
| Solar energy | [ktoe] | ||||||||||
| liquid biofuels | [ktoe] | ||||||||||
| percentage of renewable energy | % | 10 | 9.5 | 9.6 | 8.8 | 9 | 7.9 | 8.6 | 8.6 | 12.4 | |
| target ReNEP | ktoe | 12 | |||||||||
| 2002 | 2003 | 2004 | 2005 | 2006 | 2007 | ||||||
| Wood & Wood Waste | [ktoe] | 445.6 | 425.5 | 453.8 | 463.4 | 467.2 | 448.7 | ||||
| Biogas | [ktoe] | 4.3 | 5.1 | 5.8 | 6.6 | 6.8 | 8.4 | ||||
| Hydro Power | [ktoe] | 326 | 285 | 254 | 352 | 298 | 308.8 | ||||
| Geothermal Energy | [ktoe] | 16 | 16.4 | 17 | |||||||
| Solar energy | [ktoe] | 6.1 | 6.4 | 6.8 | |||||||
| liquid biofuels | [ktoe] | 2 | |||||||||
| percentage of renewable energy | % | 11.5 | 10.4 | 10.3 | 11.5 | 10.6 | 10.5 | ||||
| target ReNEP | ktoe | 12 | 12 | 12 | 12 | 12 | 12 |
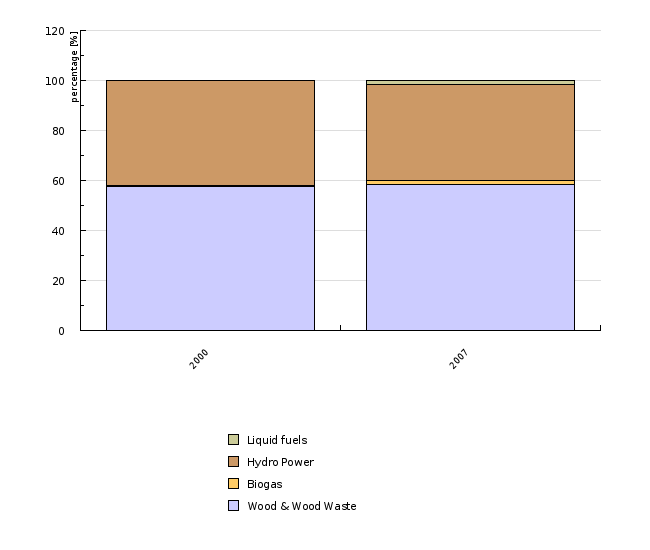
Figure EN18-2: Missing title
Sources:
Jozef Stefan Institute, 2008; Statistical Office of the Republic of Slovenia, 2008; Ministry of the Environment and Spatial Planning, 2008.
| 2000 | 2007 | ||
|---|---|---|---|
| Wood & Wood Waste | ktoe | 454.3 | 428.8 |
| Biogas | ktoe | 3.6 | 11.9 |
| Hydro Power | ktoe | 330 | 280.8 |
| Liquid fuels | ktoe | 0 | 13 |
| Wood & Wood Waste | % | 57.7 | 58.4 |
| Biogas | % | 0.5 | 1.6 |
| Hydro Power | % | 41.9 | 38.2 |
| Liquid fuels | % | 0 | 1.8 |
| Total | ktoe | 787.9 | 734.5 |
Figure EN18-3: Missing title
Sources:
Jozef Stefan Institute, 2008; Statistical Office of the Republic of Slovenia, 2008; Ministry of the Environment and Spatial Planning, 2008.
| 2007 | ||
|---|---|---|
| Wood & Wood Waste | ktoe | 428.8 |
| Biogas | ktoe | 11.9 |
| Hydro Power | ktoe | 280.8 |
| Geothermal Energy | ktoe | 17.6 |
| Solar energy | ktoe | 7.5 |
| liquid biofuels | ktoe | 13 |
| TOTAL | ktoe | 759.6 |
| Wood & Wood Waste | % | 56.5 |
| Biogas | % | 1.6 |
| Hydro Power | % | 37 |
| Geothermal Energy | % | 2.3 |
| Solar energy | % | 1 |
| liquid biofuels | % | 1.7 |
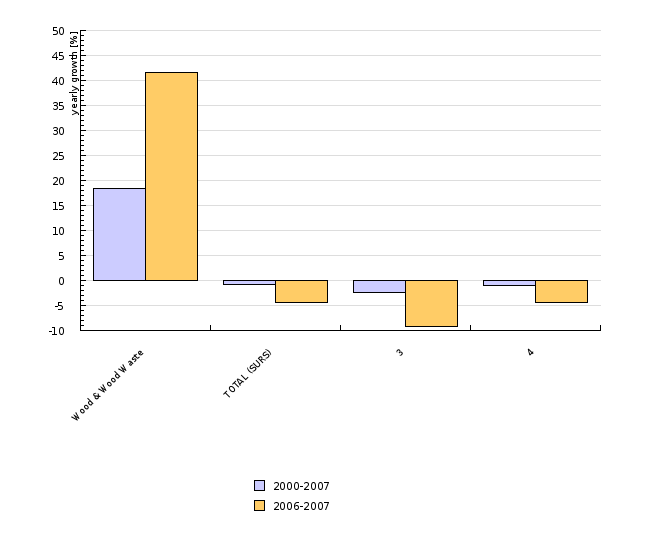
Figure EN18-4: Missing title
Sources:
Statistical Office of the Republic of Slovenia, 2008.
| Wood & Wood Waste | TOTAL (SURS) | ||
|---|---|---|---|
| 2000-2007 | % | 18.5 | -0.8 |
| 2006-2007 | % | 41.6 | -4.4 |
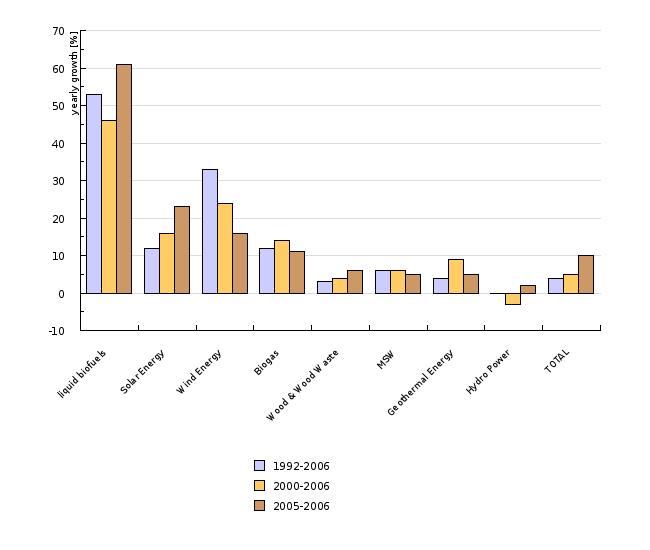
Figure EN18-5: Missing title
Sources:
Statistical Office of the European Communities, 2008.
| liquid biofuels | Solar Energy | Wind Energy | Biogas | Wood & Wood Waste | MSW | Geothermal Energy | Hydro Power | TOTAL | ||
|---|---|---|---|---|---|---|---|---|---|---|
| 1992-2006 | % | 53 | 12 | 33 | 12 | 3 | 6 | 4 | 0 | 4 |
| 2000-2006 | % | 46 | 16 | 24 | 14 | 4 | 6 | 9 | -3 | 5 |
| 2005-2006 | % | 61 | 23 | 16 | 11 | 6 | 5 | 5 | 2 | 10 |
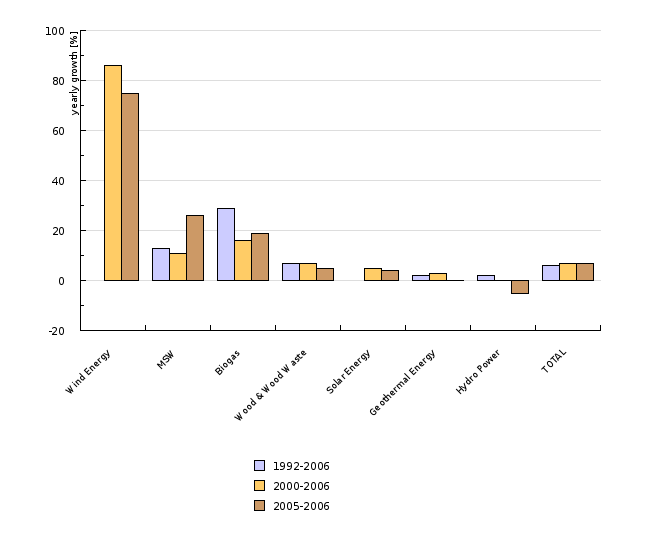
Figure EN18-6: Missing title
Sources:
Statistical Office of the European Communities, 2008.
| Wind Energy | MSW | Biogas | Wood & Wood Waste | Solar Energy | Geothermal Energy | Hydro Power | TOTAL | ||
|---|---|---|---|---|---|---|---|---|---|
| 1992-2006 | % | 13 | 29 | 7 | 2 | 2 | 6 | ||
| 2000-2006 | % | 86 | 11 | 16 | 7 | 5 | 3 | 0 | 7 |
| 2005-2006 | % | 75 | 26 | 19 | 5 | 4 | 0 | -5 | 7 |
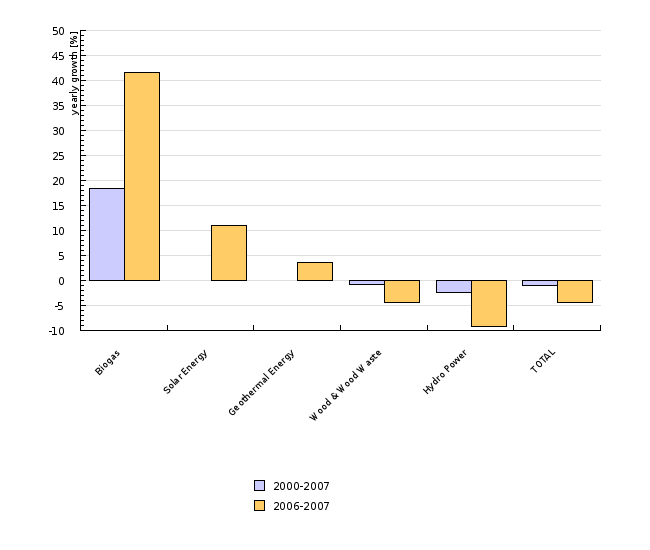
Figure EN18-7: Missing title
Sources:
Statistical Office of the Republic of Slovenia, 2007; Jozef Stefan Institute, 2008.
| Biogas | Solar Energy | Geothermal Energy | Wood & Wood Waste | Hydro Power | TOTAL | ||
|---|---|---|---|---|---|---|---|
| 2000-2007 | % | 18.5 | -0.8 | -2.3 | -1 | ||
| 2006-2007 | % | 41.6 | 11 | 3.7 | -4.4 | -9.1 | -4.3 |


