-
-
-
-
-
-
-
-
Tools and collections
- Environmental atlas
- EIONET in Slovenia
- Environmental indicators
- IED devices
- Endangered species
- IS-waste

-
-
Tools and collections
- Environmental atlas
- EIONET in Slovenia
- Environmental indicators
- IED devices
- Endangered species
- IS-waste

[VD07] Phosphorus in lakes

Key message

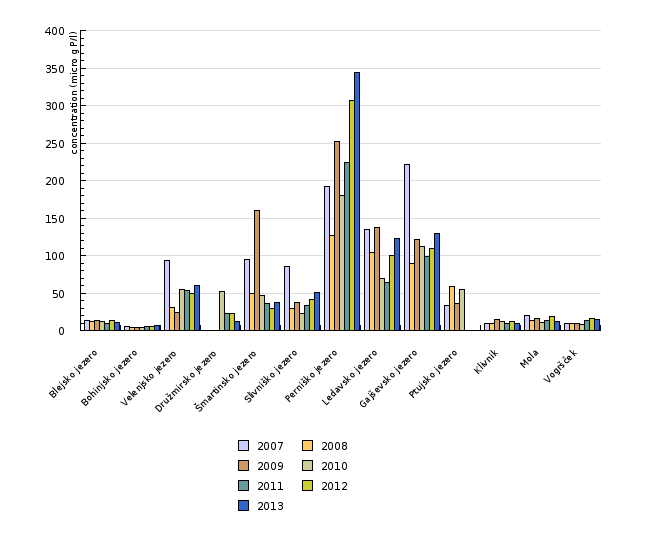
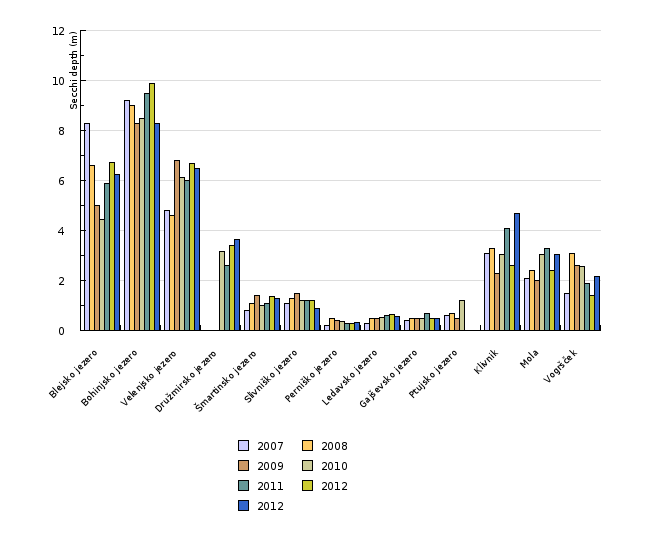
In Europe, the number of lakes with low phosphorus content and greater transparency is increasing, as a result of measures taken to reduce pressures of to lakes and their contributing areas. Compared to the situation in seventies, after the introduction of recovery measures, improvement has been observed in Lake Bled as well, however overburden with phosphorous compounds is still occasionally present, with impact on increased phytoplankton biomass and reduced transparency of the lake. Lake Bohinj is one of the oligotrophic, flow-through alpine lakes where the effects of man in the lake’s water basin, covering a sparsely populated mountain karst area, are relatively mild. The concentration of phosphorous is relatively low and reduces the productivity of phytoplankton. In the artificial reservoirs, especially those in central and north-eastern Slovenia, where agriculture is the main activity, the average content of phosphorus is significantly higher and transparency lower than in natural lakes, with no trend of improvement.
Definition
Charts
Standardised Database for Water Quality Monitoring, Environmental Agency of the Republic of Slovenia, 2014
| Blejsko jezero | Bohinjsko jezero | Velenjsko jezero | Družmirsko jezero | Šmartinsko jezero | Slivniško jezero | Perniško jezero | Ledavsko jezero | Gajševsko jezero | Ptujsko jezero | ||
|---|---|---|---|---|---|---|---|---|---|---|---|
| 2007 | micro g P/l | 12.7 | 5.2 | 94 | 95 | 85 | 192 | 135 | 222 | 33.8 | |
| 2008 | micro g P/l | 11.6 | 3.6 | 30.4 | 48.7 | 29.2 | 126.2 | 103.5 | 88.7 | 58.7 | |
| 2009 | micro g P/l | 13.2 | 3.5 | 24.5 | 160.2 | 37.5 | 252.4 | 137.1 | 122 | 35.5 | |
| 2010 | micro g P/l | 11.5 | 4.1 | 54.8 | 52 | 46.3 | 22.7 | 179.7 | 69.6 | 112 | 55.1 |
| 2011 | micro g P/l | 10 | 5 | 53 | 23 | 36 | 34 | 224 | 64 | 99 | |
| 2012 | micro g P/l | 13.3 | 5.3 | 49.4 | 23 | 29.7 | 41.6 | 306.6 | 99.7 | 109.5 | |
| 2013 | micro g P/l | 11.2 | 6.2 | 60.3 | 12.3 | 36.9 | 50.4 | 343.4 | 123.1 | 129.7 | |
| Klivnik | Mola | Vogršček | |||||||||
| 2007 | micro g P/l | 9.2 | 19.4 | 9.2 | |||||||
| 2008 | micro g P/l | 9.9 | 13.7 | 9.2 | |||||||
| 2009 | micro g P/l | 15 | 15.4 | 9.9 | |||||||
| 2010 | micro g P/l | 11.6 | 10.6 | 8.2 | |||||||
| 2011 | micro g P/l | 9 | 13.2 | 13.7 | |||||||
| 2012 | micro g P/l | 12.1 | 18.4 | 16.3 | |||||||
| 2013 | micro g P/l | 9.3 | 12.7 | 14.9 |
Standardised Database for Water Quality Monitoring, Environmental Agency of the Republic of Slovenia, 2014
| Blejsko jezero | Bohinjsko jezero | Velenjsko jezero | Družmirsko jezero | Šmartinsko jezero | Slivniško jezero | Perniško jezero | Ledavsko jezero | Gajševsko jezero | Ptujsko jezero | ||
|---|---|---|---|---|---|---|---|---|---|---|---|
| 2007 | Secchi depth (m) | 8.3 | 9.2 | 4.8 | 0.8 | 1.1 | 0.2 | 0.3 | 0.4 | 0.6 | |
| 2008 | Secchi depth (m) | 6.6 | 9 | 4.6 | 1.1 | 1.3 | 0.5 | 0.5 | 0.5 | 0.7 | |
| 2009 | Secchi depth (m) | 5 | 8.3 | 6.8 | 1.4 | 1.5 | 0.4 | 0.5 | 0.5 | 0.5 | |
| 2010 | Secchi depth (m) | 4.5 | 8.5 | 6.1 | 3.2 | 1 | 1.2 | 0.4 | 0.5 | 0.5 | 1.2 |
| 2011 | Secchi depth (m) | 5.9 | 9.5 | 6 | 2.6 | 1.1 | 1.2 | 0.3 | 0.6 | 0.7 | |
| 2012 | Secchi depth (m) | 6.7 | 9.9 | 6.7 | 3.4 | 1.4 | 1.2 | 0.3 | 0.6 | 0.5 | |
| 2012 | Secchi depth (m) | 6.2 | 8.3 | 6.5 | 3.7 | 1.3 | 0.9 | 0.3 | 0.6 | 0.5 | |
| Klivnik | Mola | Vogršček | |||||||||
| 2007 | Secchi depth (m) | 3.1 | 2.1 | 1.5 | |||||||
| 2008 | Secchi depth (m) | 3.3 | 2.4 | 3.1 | |||||||
| 2009 | Secchi depth (m) | 2.3 | 2 | 2.6 | |||||||
| 2010 | Secchi depth (m) | 3 | 3 | 2.6 | |||||||
| 2011 | Secchi depth (m) | 4.1 | 3.3 | 1.9 | |||||||
| 2012 | Secchi depth (m) | 2.6 | 2.4 | 1.4 | |||||||
| 2012 | Secchi depth (m) | 4.7 | 3 | 2.2 |
Špela Remec Rekar, Slovenian Environment Agency


