


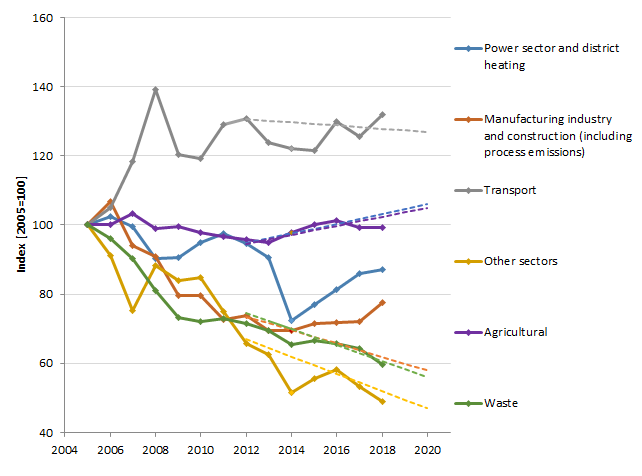
Title: Non-ETS emissions trends in sectors in the period 2005−2018 compared to the projections for 2020 and the linear target trajectory in the period 2012−2020 (dashed lines)
Sources:
Chart type
Pie
Title position
Outside
Legend position
Bottom
Add data
Labels rotation
0°
Axis type
Linear
Title font weight
Normal
Title font style
Normal
Labels font weight
Normal
Labels font style
Normal
Use new axis
FALSE
Chart type
Line
Chart title color
#333333
Chart title font weight
Bold
Chart title font style
Normal
Chart title font size
24
Chart font
'Open Sans', Ariel, san-sarif
Chart font size
12px
Show tooltips
TRUE
Show data labels
FALSE
Show legend
TRUE
Legend title font weight
Bold
Legend title font style
Normal
Legend font size
12px
Horizontal axis type
Linear
Vertical axis type
Linear
Axis title color
#484849
Axis title color
#000000
Title font weight
Normal
Title font weight
Normal
Title font style
Normal
Title font style
Normal
Title font size
12px
Title font size
12px
Labels Color
#484849
Labels color
#484848
Labels font weight
Normal
Labels font weight
Normal
Labels font style
Normal
Labels font style
Normal
Labels font size
12px
Labels font size
12px
Labels rotation
0°
Labels rotation
0°
Grid line color
#d0d2d3
Grid line color
#d0d2d3
Base line color
#333333
Base line color
#333333
Minor grid line color
#d0d2d3
Minor grid line color
#d0d2d3
Legend font style
Normal
Legend title font size
12px
Legend font weight
Normal
Stacking
FALSE
Chart image

Override table data