Environmental indicators in Slovenia
The web portal Environmental Indicators in Slovenia provides access to over 100 indicators which use graphs, maps and comments to present the environmental trends in Slovenia. The indicators are organized into thematic groups – chapters covering environmental components (e.g. water, air), environmental issues (e.g. climate change, nature protection, loss of biodiversity, waste management) and the incorporation of environmental content in the formulation of sector policies (e.g. transport, agriculture, tourism, energy, instruments of environmental policy). The indicators represent one of the four pillars of our environmental reporting, based on the demands in article 106 of the Environment Protection Act (Official Gazette of the RS, No. 41/2004 with changes). Based on numerical data, they indicate state, characteristics and trends of environmental development in Slovenia. They are produced via interlinkages among the data and observations as shown on pyramid.
What are environmental indicators?
Environmental indicators are among the most effective tools for reporting on the environment. They are as warning signs for certain trends. Thus, draw attention to changes, some of which might be irreversible. Due to the vulnerability of ecosystems and pressures on them, the state of the environment must be monitored comprehensively, since unsustainable consumption of natural resources dictated by economic development results in excessive environmental pollution and puts human health at risk.
The term of environmental indicators denotes data selected and presented in an agreed manner which we attempt to tie to environmental policy objectives. Appropriately selected indicators that are based on a sufficiently long time series of data may point at key development trends of a specific phenomenon. Therefore, they may be helpful for decision makers when planning and managing the environment, and also for the general public in their understanding of environmental issues. They may also be used by public institutions to monitor thematic strategies.
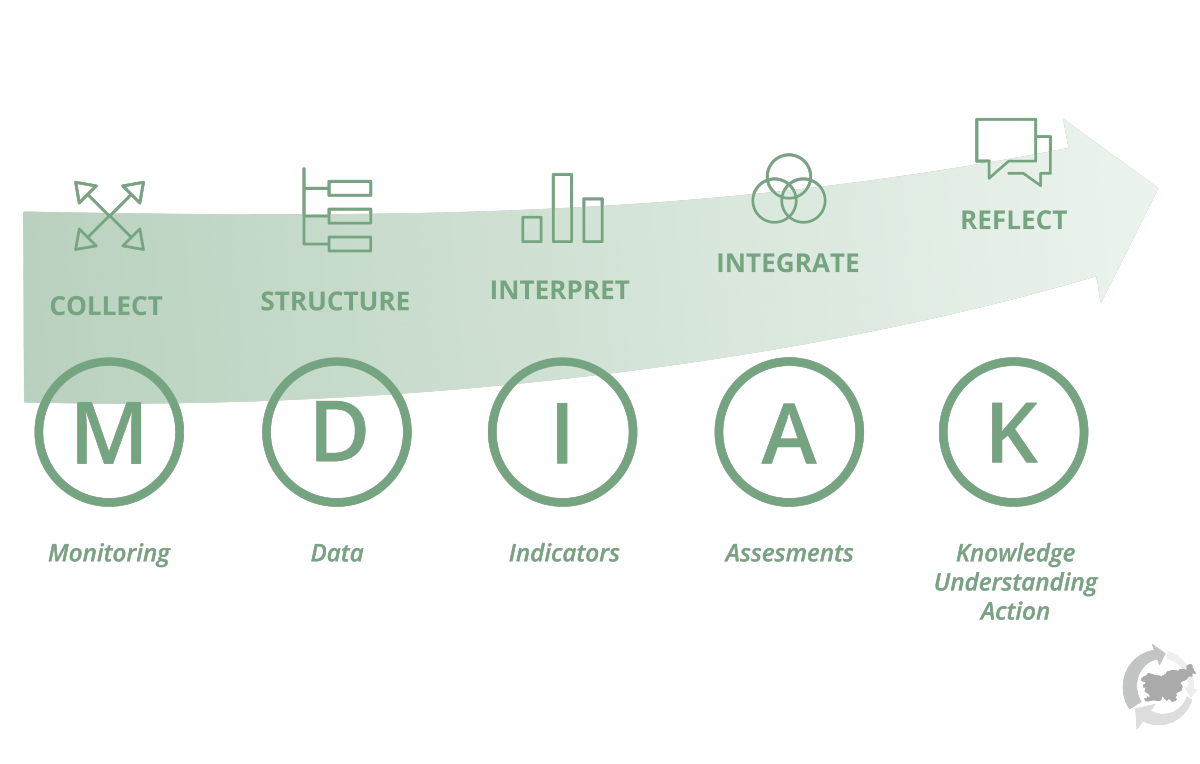
The basis for each indicator is a suitable database (Figure 1). The structuring of information facilitates the preparation of a suitable interpretation of the trend of a selected phenomenon. This structuring is the basis for assessing the state of the environment. The assessment is usually prepared by combining indicators. In this way, new knowledge is created and a better understanding of the phenomenon is facilitated. The latter is the basis for action.

Figure 1: MDIAK information chainSource: European Environment Agency (EEA)
Indicator selection method
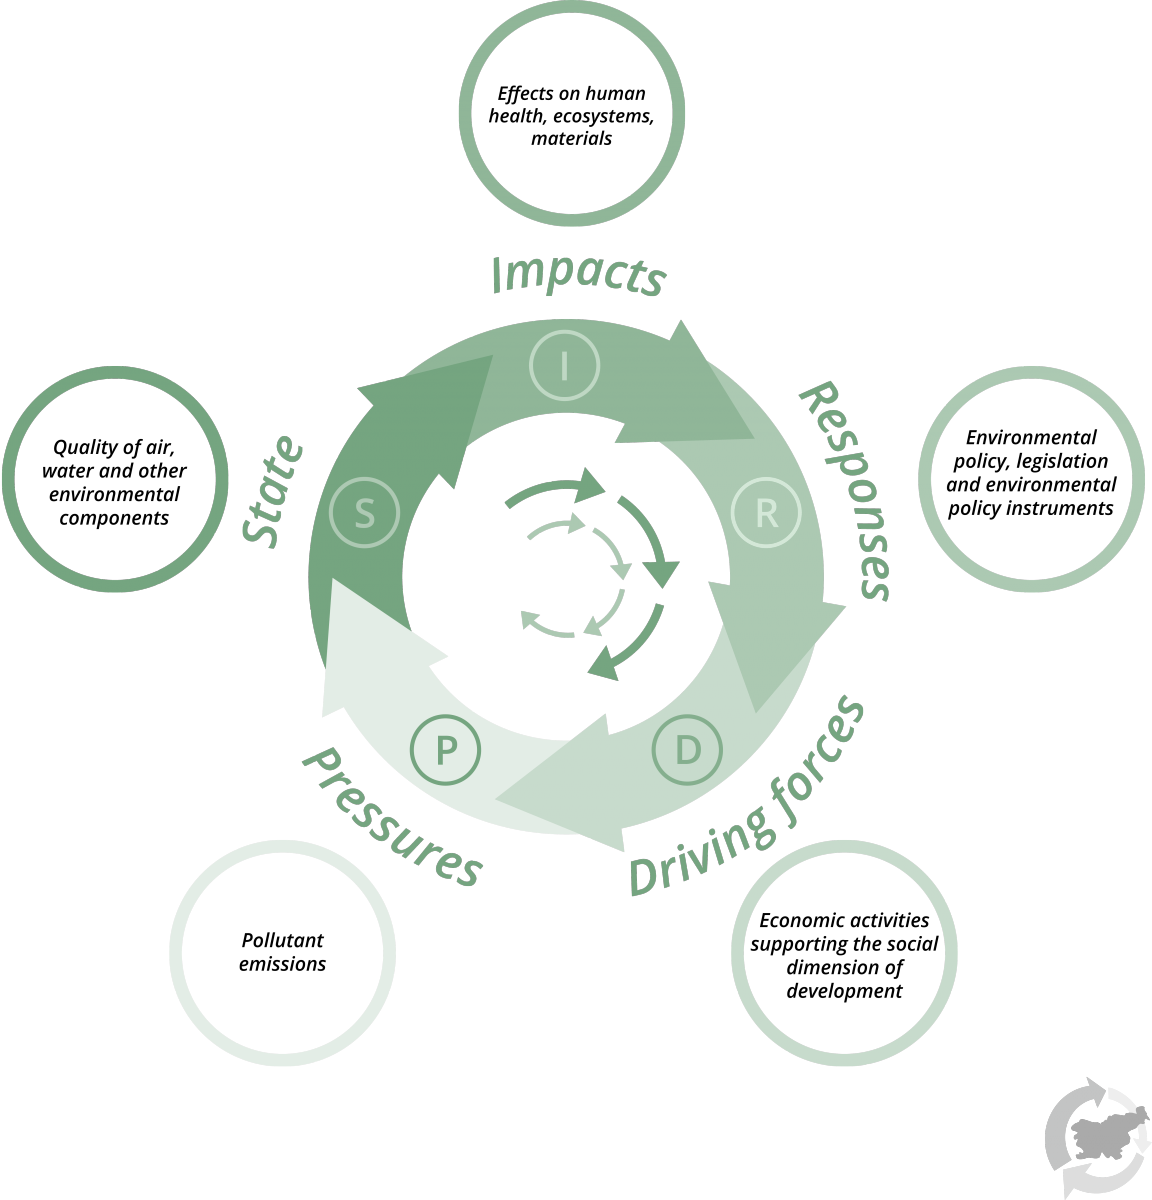
Sets of indicators are using an assessment framework, which helps to determine functions of each indicator. The European Environment Agency divided the framework into five categories: the DPSIR framework, which includes driving forces pressures, state, impacts and responses. Each individual set has its own purpose (Figure 2):
- Driving forces are socio-economic factors and activities which either increase or mitigate the pressures on the environment, e.g. the extent of economic, transport or tourist activities.
- Pressures are direct anthropogenic pressures and impacts on the environment, e.g. pollutant discharges or use of natural resources.
- State implies the current condition and trends of a certain environmental phenomenon such as the degree of air, water and soil pollution, biodiversity in a specific geographic area, the availability of natural resources (e.g. wood, freshwater).
- Impacts are the effects of the changed environment on the health of humans and other species.
- Responses are reactions of the society to environmental issues. Responses may include specific state measures, e.g. taxes on the use of natural resources. Decisions by businesses and individuals, e.g. corporate investments in pollution control or purchases of recycled goods by households, are equally important.


Figure 2: DPSIR assessment framework Source: European Environment Agency
The Environmental Indicators in Slovenia website provides access to over 180 indicators, divided into topic themes/sets. The latter refer to environmental components (like water, air), environmental issues (climate change, nature conservation, loss of biodiversity, waste management, green economy) and sectoral policies (transport, agriculture, energy, health, forestry, environmental policy instruments).
Presentation of indicators
At the website Environmental Indicators in Slovenia, all indicators are presented in the same way in order to ensure that indicators can be read by an average user.
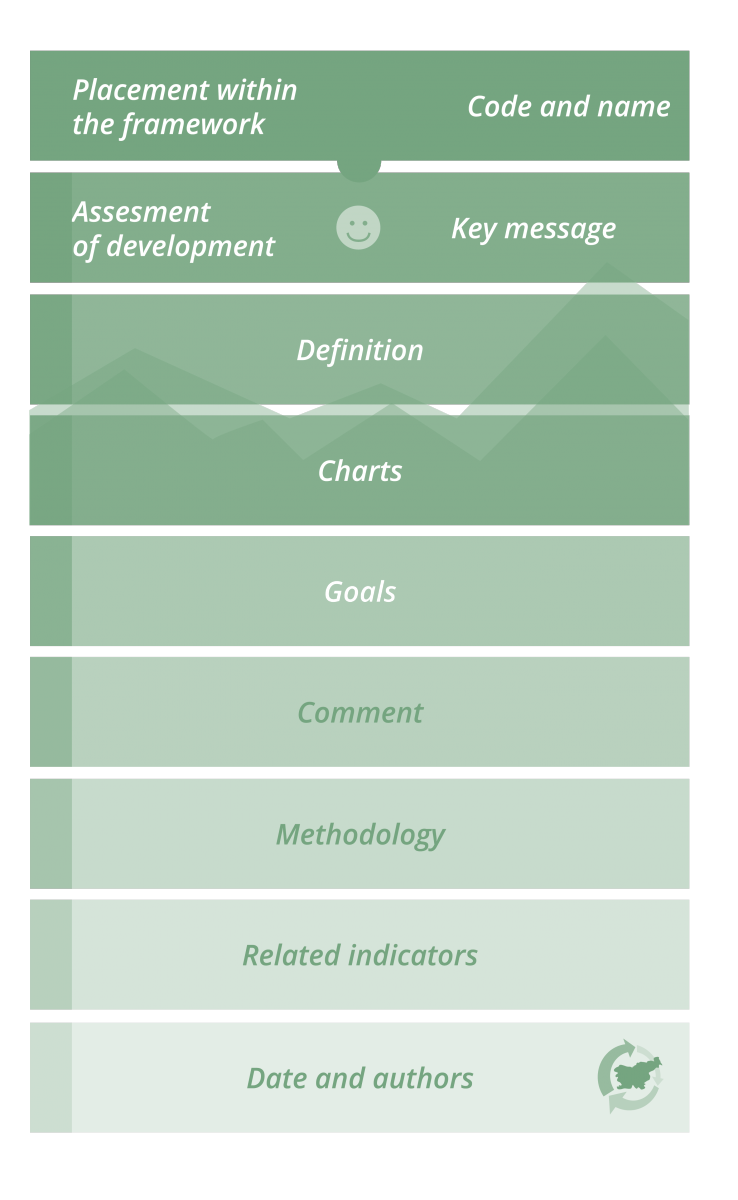
Each indicator has its fact sheet and methodological sheet, whose components are built hierarchically (Figure 3). The methodological sheet combines elements of the methodological description (the name of the indicator, definition, methodology). The fact sheet is based on information, its form of presentation (table, graph, chart), comment, the key message and trend assessment.
Figure 3: Methodology and fact sheet of indicators

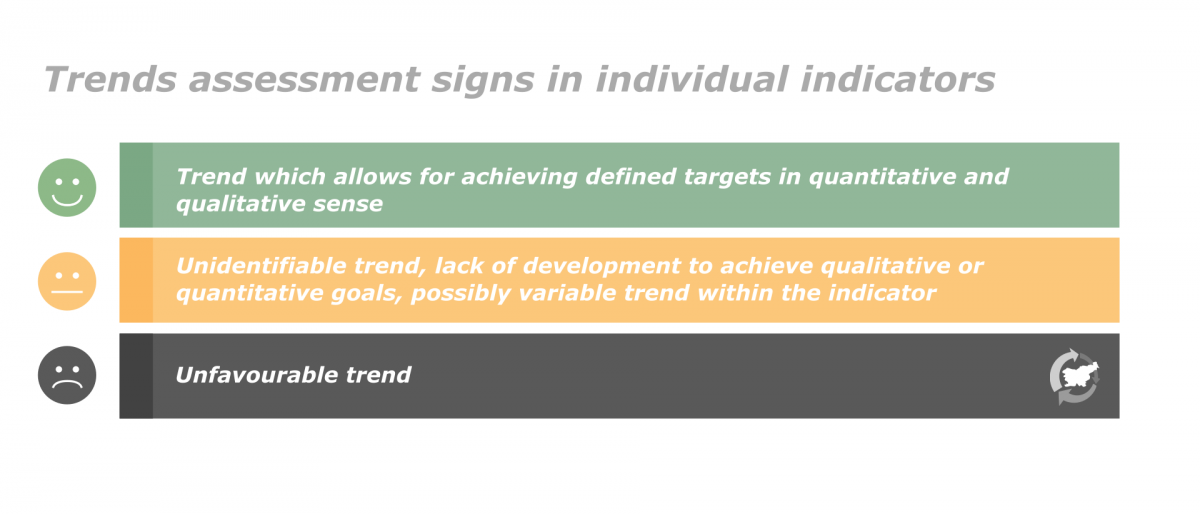
In addition to the above-mentioned elements, each indicator has its own code, unambiguous name, position marked in the DPSIR assessment framework and a trend assessment. The trend assessment is part of the expert judgement by the author of the indicator. It is described with a symbol, as shown in Figure 4. The highlights of the analysis which justify the expert decision on trend assessment are part of the key message of each indicator.
Crucial to assess the trend development of a certain phenomenon is knowledge of the desired direction and intensity of development. Therefore, the goal we want to monitor is provided with each indicator. The goal of an indicator facilitates its monitoring through temporal and spatial data set. It is defined by national and EU legislative bases, EU or global strategies (such as Agenda 2030) or recommendations of organisations such as the World Health Organisation, OECD.

Figure 4: Trend assessment symbols Source: Environmental Indicators in Slovenia, 2017.
The definition of each indicator provides the fundamental information on the measurement and display method of the indicator. Due to benchmarking, we most frequently used methodological sheets for indicators prepared by the European Environment Agency. Where necessary, the methodology was adjusted to the situation in Slovenia or dictated by the phenomenon, the monitoring method of the phenomenon, the accessibility of information or other expert factors.
The quantity values of an indicator are most frequently expressed in annual values for the period beginning in 1992, and shown with graphs and tables, in some cases also with charts. A comment explaining the trend development and alleged causes of such development, and implemented and planned measures to improve or preserve a good state is added.
The “Methodology” section contributes to the clarity of the monitoring methods applied for selected indicators. This section fully describes data sources and provides additional methodological notes.
Figure 5: Format of selected indicators presented at the Environmental Indicators in Slovenia website

Use of indicators
Environmental indicators in Slovenia are essential input for the national report on the environment and for the Slovenian submission published in the European report on the state and outlook for the environment. They are also used to prepare other international reports, and for the needs of monitoring the progress related to the national operational programmes and national strategies.
They are an indispensable learning tool for students and teachers, as they provide access to environmental information in one place. They frequently facilitate a dialogue between decision makers and representatives of the non-governmental sector, and help with raising environmental awareness. They may also be used to efficiently support development of new topics with huge importance of the environment component, like green economy, biodiversity, resource efficiency.
Last, but not least, environmental indicators are among the most useful tools for environmental reporting, since they provide a comprehensive overview of environmental changes, information about the state of the environment and a good overview of data sources. It is also important that they serve as an effective alert signs for wider public and decision makers and make us aware that environment has its own limits. Thus, they effectively contribute to the development of sustainable environmental policies, and to integrated environmental assessment of the environment in Slovenia.


