-
-
-
-
-
-
-
-
Tools and collections
- Environmental atlas
- EIONET in Slovenia
- Environmental indicators
- IED devices
- Endangered species
- IS-waste

-
-
Tools and collections
- Environmental atlas
- EIONET in Slovenia
- Environmental indicators
- IED devices
- Endangered species
- IS-waste

[EN27] Energy efficiency and energy consumption in the transport sector

Key message

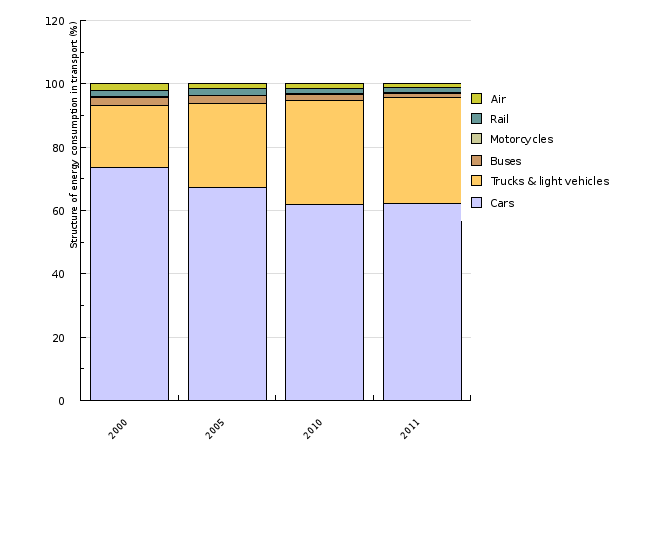
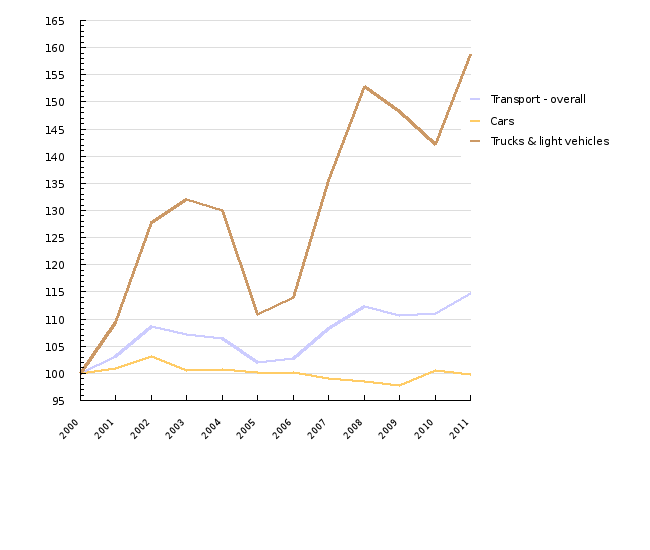
The most of energy in transport is used in cars, followed by trucks, the share of which is growing very fast. Efficiency of energy use with excluded influence of transit transport is improving, but too slow.
Definition
The indicator shows distribution of energy use in transport regarding type of transport (road transport, rail transport, air transport) and further on also distribution of energy use in road transport regarding types of vehicles (cars, trucks, buses and motorbykes). Additional indicator shows movement of energy efficiency in transport.
Energy efficiency affects energy use. Increase of energy efficiency affects, at the same activity, reduction of energy use. If increase of energy efficiency affects activity increase, the so called rebound effect happens.
Charts
Statistical Office of RS, 2012; Environmental Agency of RS, 2012; Jožef Stefan Institute, 2012.
| 2000 | 2005 | 2010 | 2011 | ||
|---|---|---|---|---|---|
| Cars | % | 73.6 | 67.4 | 61.9 | 62.1 |
| Trucks & light vehicles | % | 19.5 | 26.4 | 32.8 | 33.5 |
| Buses | % | 2.7 | 2.4 | 1.9 | 1.4 |
| Motorcycles | % | 0.1 | 0.3 | 0.4 | 0.5 |
| Rail | % | 1.9 | 1.9 | 1.5 | 1.3 |
| Air | % | 2.1 | 1.6 | 1.5 | 1.3 |
Jožef Stefan Institute, 2012
| 2000 | 2001 | 2002 | 2003 | 2004 | 2005 | 2006 | 2007 | 2008 | 2009 | ||
|---|---|---|---|---|---|---|---|---|---|---|---|
| Transport - overall | 2000=100 | 100 | 103.2 | 108.6 | 107.2 | 106.5 | 102 | 102.7 | 108.3 | 112.4 | 110.6 |
| Cars | 2000=100 | 100 | 100.9 | 103.1 | 100.6 | 100.8 | 100.2 | 100.1 | 99.1 | 98.5 | 97.7 |
| Trucks & light vehicles | 2000=100 | 100 | 109.4 | 127.7 | 132 | 130 | 110.8 | 114 | 135.5 | 152.9 | 148.3 |
| 2010 | 2011 | ||||||||||
| Transport - overall | 2000=100 | 111 | 114.7 | ||||||||
| Cars | 2000=100 | 100.5 | 99.7 | ||||||||
| Trucks & light vehicles | 2000=100 | 142.2 | 158.8 |
Jožef Stefan Institute, 2012.
| 2000 | 2001 | 2002 | 2003 | 2004 | 2005 | 2006 | 2007 | 2008 | 2009 | ||
|---|---|---|---|---|---|---|---|---|---|---|---|
| Transport - overall | 2000=100 | 100 | 103.2 | 108.6 | 107.2 | 106.5 | 100.9 | 98.2 | 97.9 | 95.6 | 95.6 |
| Cars | 2000=100 | 100 | 100.9 | 103.1 | 100.6 | 100.8 | 100.5 | 100.2 | 99.4 | 98.9 | 97.7 |
| Trucks & light vehicles | 2000=100 | 100 | 109.4 | 127.7 | 132 | 130 | 106.3 | 96.4 | 97.4 | 92.6 | 93.6 |
| 2010 | 2011 | ||||||||||
| Transport - overall | 2000=100 | 97 | 96.1 | ||||||||
| Cars | 2000=100 | 100.5 | 99.9 | ||||||||
| Trucks & light vehicles | 2000=100 | 93 | 91.2 |
EEA, 2012.
| 2004 | 2005 | 2006 | 2007 | 2008 | 2009 | 2010 | 2011 | ||
|---|---|---|---|---|---|---|---|---|---|
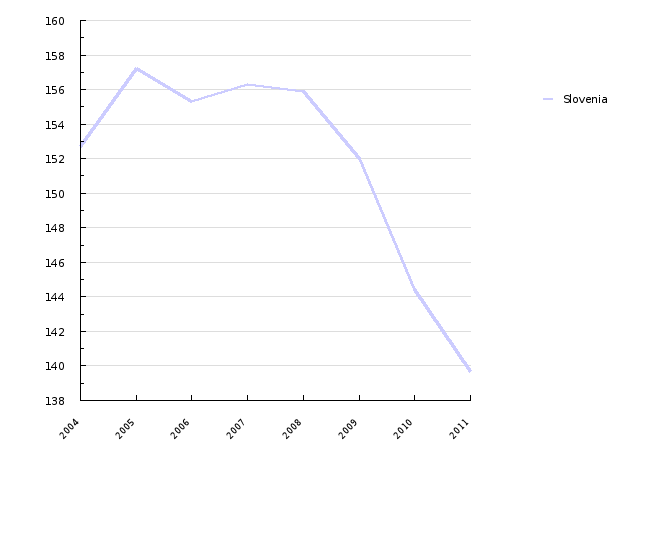
| Slovenia | gCO2/km | 152.7 | 157.2 | 155.3 | 156.3 | 155.9 | 152 | 144.4 | 139.7 |
Related indicators
Matjaž Česen, Institut Jožef Stefan


