[KM14] Emissions of Methane and Nitrous Oxide from Agriculture

Key message

Greenhouse gas emissions, methane and nitrous oxide, in agriculture were reduced by 14% from 1986 until 2011. The reduction is mainly the result of lower volume of cattle, pigs and poultry as well as improved methods of handling livestock manure.
Definition
Charts
Slovenian Environmet Agency, 2013.
| 2011 | ||
|---|---|---|
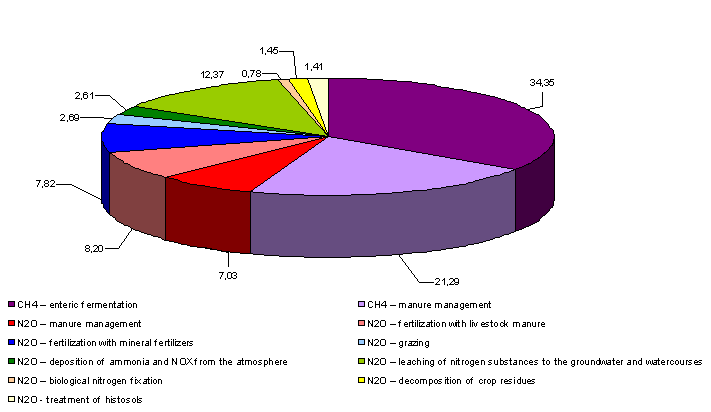
| CH4 – enteric fermentation | % | 34.4 |
| CH4 – manure management | % | 21.3 |
| N2O – manure management | % | 7 |
| N2O – fertilization with livestock manure | % | 8.2 |
| N2O – fertilization with mineral fertilizers | % | 7.8 |
| N2O – grazing | % | 2.7 |
| N2O – deposition of ammonia and NOX from the atmosphere | % | 2.6 |
| N2O – leaching of nitrogen substances to the groundwater and watercourses | % | 12.4 |
| N2O – biological nitrogen fixation | % | 0.8 |
| N2O – decomposition of crop residues | % | 1.5 |
| N2O - treatment of histosols | % | 1.4 |
Slovenian Environment Agency, 2013.
| 1986 | 1987 | 1988 | 1989 | 1990 | 1991 | 1992 | 1993 | 1994 | 1995 | ||
|---|---|---|---|---|---|---|---|---|---|---|---|
| Methane emissions | index 1986=100 | 100 | 99.9 | 98.8 | 97.9 | 98.7 | 92.8 | 97.6 | 94.2 | 94.7 | 93.7 |
| Nitrous oxide emissions | index 1986=100 | 100 | 103.1 | 99.3 | 95.2 | 94.2 | 88.2 | 99.5 | 90.1 | 90.9 | 90.9 |
| Kyoto target 2008-2012 | index 1986=100 | 92 | 92 | 92 | 92 | 92 | 92 | 92 | 92 | 92 | 92 |
| Methane emissions | 1000 t | 54.3 | 54.2 | 53.6 | 53.2 | 53.6 | 50.4 | 53 | 51.1 | 51.4 | 50.9 |
| Nitrous oxide emissions | 1000 t | 3.5 | 3.6 | 3.4 | 3.3 | 3.3 | 3 | 3.4 | 3.1 | 3.1 | 3.1 |
| 1996 | 1997 | 1998 | 1999 | 2000 | 2001 | 2002 | 2003 | 2004 | 2005 | ||
| Methane emissions | index 1986=100 | 91.2 | 89.3 | 92.1 | 90.7 | 98.4 | 97.3 | 101.5 | 97.3 | 94.2 | 95.5 |
| Nitrous oxide emissions | index 1986=100 | 89.1 | 91.5 | 93 | 92.9 | 94.5 | 93.1 | 95 | 90.8 | 85.4 | 85.4 |
| Kyoto target 2008-2012 | index 1986=100 | 92 | 92 | 92 | 92 | 92 | 92 | 92 | 92 | 92 | 92 |
| Methane emissions | 1000 t | 49.5 | 48.5 | 50 | 49.2 | 53.4 | 52.8 | 55.1 | 52.8 | 51.1 | 51.8 |
| Nitrous oxide emissions | 1000 t | 3.1 | 3.2 | 3.2 | 3.2 | 3.3 | 3.2 | 3.3 | 3.1 | 3 | 3 |
| 2006 | 2007 | 2008 | 2009 | 2010 | 2011 | ||||||
| Methane emissions | index 1986=100 | 96.4 | 100.4 | 96.5 | 96.6 | 95.4 | 92.8 | ||||
| Nitrous oxide emissions | index 1986=100 | 86 | 87 | 80.6 | 83.4 | 81 | 78.7 | ||||
| Kyoto target 2008-2012 | index 1986=100 | 92 | 92 | 92 | 92 | 92 | 92 | ||||
| Methane emissions | 1000 t | 52.3 | 54.5 | 52.4 | 52.5 | 51.8 | 50.4 | ||||
| Nitrous oxide emissions | 1000 t | 3 | 3 | 2.8 | 2.9 | 2.8 | 2.7 |
Slovenian Environment Agency 2013; European Environment Agency, 2013.
| 1986 | 1987 | 1988 | 1989 | 1990 | 1991 | 1992 | 1993 | 1994 | 1995 | ||
|---|---|---|---|---|---|---|---|---|---|---|---|
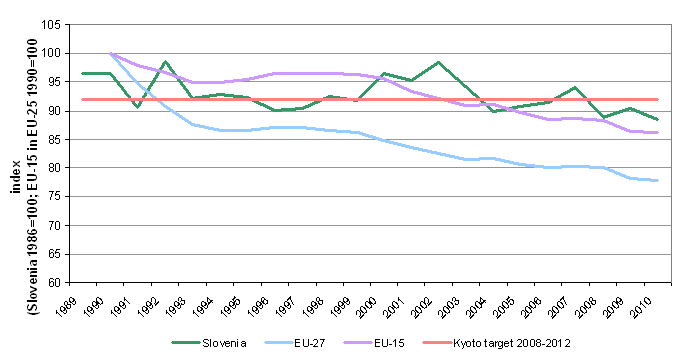
| Slovenia | % | 100 | 101.5 | 99 | 96.6 | 96.5 | 90.5 | 98.5 | 92.2 | 92.9 | 92.4 |
| EU-27 | % | 100 | 94.6 | 90.6 | 87.6 | 86.7 | 86.7 | ||||
| EU-15 | % | 100 | 97.9 | 96.8 | 94.9 | 94.9 | 95.5 | ||||
| 1996 | 1997 | 1998 | 1999 | 2000 | 2001 | 2002 | 2003 | 2004 | 2005 | ||
| Slovenia | % | 90.2 | 90.3 | 92.5 | 91.7 | 96.5 | 95.2 | 98.4 | 94.2 | 89.9 | 90.6 |
| EU-27 | % | 87.1 | 87 | 86.7 | 86.2 | 84.8 | 83.4 | 82.6 | 81.5 | 81.6 | 80.7 |
| EU-15 | % | 96.6 | 96.5 | 96.5 | 96.4 | 95.5 | 93.5 | 92.2 | 90.9 | 91 | 89.7 |
| 2006 | 2007 | 2008 | 2009 | 2010 | 2011 | ||||||
| Slovenia | % | 91.4 | 93.9 | 88.8 | 90.2 | 88.4 | 86 | ||||
| EU-27 | % | 80 | 80.2 | 80.1 | 78.2 | 77.7 | |||||
| EU-15 | % | 88.5 | 88.6 | 88.4 | 86.4 | 86.2 |
Slovenian Environment Agency, 2013.
| Manure manegement - cattle | Manure manegement- pigs | Manure manegement- poultry | Manure manegement - sheep, goats, horses | - | Enteric fermentation - cattle | Enteric fermentation - pigs | Enteric fermentation - sheep, goats, horses | ||
|---|---|---|---|---|---|---|---|---|---|
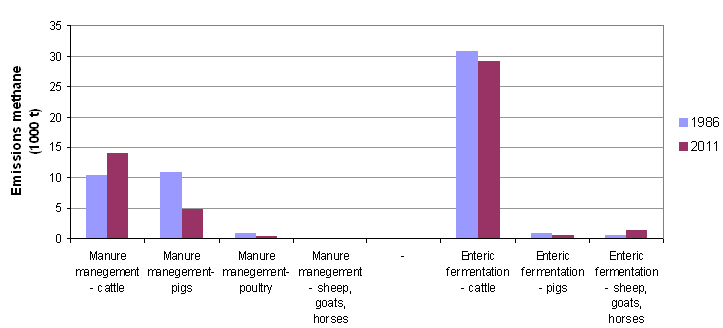
| 1986 | 1000 t | 10.405 | 10.87 | 0.783 | 0.026 | 30.793 | 0.895 | 0.514 | |
| 2011 | 1000 t | 14.103 | 4.8 | 0.313 | 0.053 | 29.126 | 0.521 | 1.446 | |
| Methane emissions from agriculture | Index (1986=100) | 135.544 | 44.159 | 39.906 | 202.832 | 94.588 | 58.231 | 281.481 |
Slovenian Environment Agency, 2013.
| nitrogen leaching | fertilization with mineral fertilizers | fertilization with livestock manures | manure managenment | deposition of nitrogen substances from the atmosphere | grazing | decomposition of crop residues | processing histosol | biological nitrogen fixation | ||
|---|---|---|---|---|---|---|---|---|---|---|
| 1986 | t | 889 | 526 | 681 | 894 | 190 | 77 | 86 | 93 | 20 |
| 2011 | t | 759 | 480 | 503 | 431 | 160 | 165 | 89 | 86 | 48 |
| Nitrous oxide emissions | Index 2010/1986 | 85 | 91 | 74 | 48 | 84 | 214 | 104 | 93 | 238 |
Goals
In accordance with the signing of the Kyoto Protocol Slovenia in the period 2008-2012 has to reduce greenhouse gas emissions by 8% by value in 1986. In accordance with decision no. 406/2009, each Member State by 2020 to limit greenhouse gas emissions at least by the percentage set for that Member State in relation to its emissions in 2005. Slovenia thus may be omitted for 4% higher than emissions in 2005.


