[SE02] Demographic changes
[SE02] Demographic changes

Definition
Charts
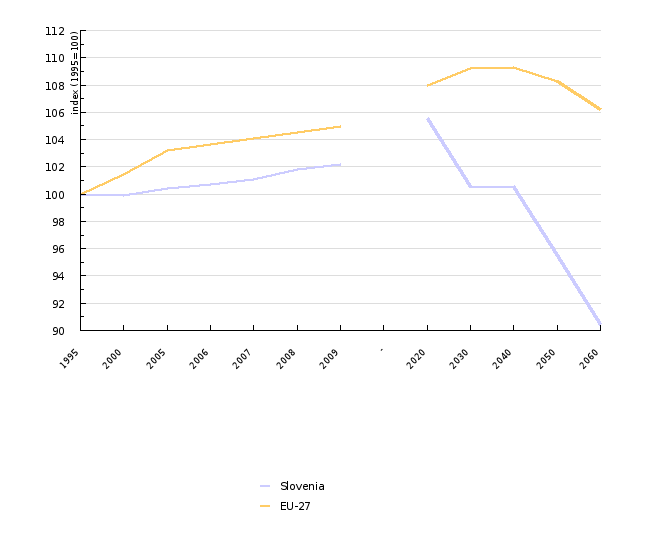
Figure SE02-1: Missing title
Sources:
SI-STAT podatkovni portal, Demografsko in socialno področje, 2010; EUROSTAT, Population and social conditions, 2010, Economic policy committee, 2008.
| 1995 | 2000 | 2005 | 2006 | 2007 | 2008 | 2009 | - | 2020 | 2030 | ||
|---|---|---|---|---|---|---|---|---|---|---|---|
| Slovenia | 1000000 | 2 | 2 | 2 | 2 | 2 | 2 | 2 | 2.1 | 2 | |
| EU-27 | 1000000 | 476 | 482.8 | 491.2 | 493.2 | 495.3 | 497.6 | 499.7 | 513.8 | 519.9 | |
| Slovenia | index (1995=100) | 100 | 99.9 | 100.4 | 100.7 | 101.1 | 101.8 | 102.2 | 105.6 | 100.5 | |
| EU-27 | index (1995=100) | 100 | 101.4 | 103.2 | 103.6 | 104 | 104.5 | 105 | 107.9 | 109.2 | |
| 2040 | 2050 | 2060 | |||||||||
| Slovenia | 1000000 | 2 | 1.9 | 1.8 | |||||||
| EU-27 | 1000000 | 520.1 | 515.3 | 505.7 | |||||||
| Slovenia | index (1995=100) | 100.5 | 95.5 | 90.5 | |||||||
| EU-27 | index (1995=100) | 109.3 | 108.3 | 106.2 |
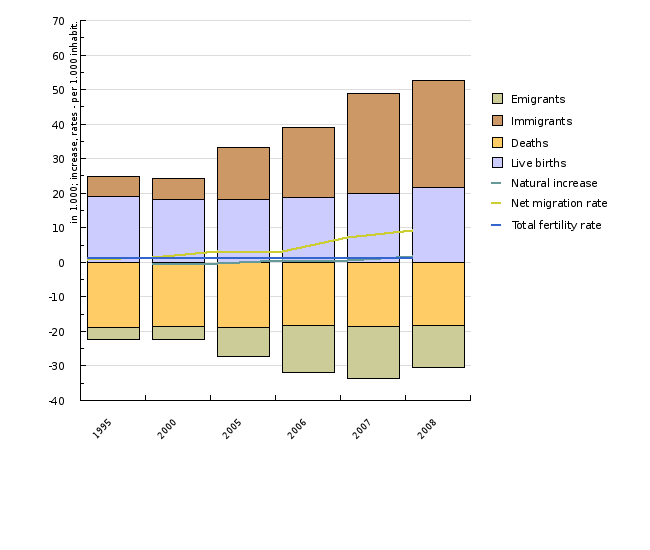
Figure SE02-2: Missing title
Sources:
SI-STAT podatkovni portal, Demografsko in socialno področje, 2010.
| 1995 | 2000 | 2005 | 2006 | 2007 | 2008 | ||
|---|---|---|---|---|---|---|---|
| Live births | 1000 | 19 | 18.2 | 18.2 | 18.9 | 19.8 | 21.8 |
| Deaths | 1000 | -19 | -18.6 | -18.8 | -18.2 | -18.6 | -18.3 |
| Immigrants | 1000 | 5.9 | 6.2 | 15 | 20 | 29.2 | 30.7 |
| Emigrants | 1000 | -3.4 | -3.6 | -8.6 | -13.7 | -14.9 | -12.1 |
| Natural increase | per 1000 inhabit. | np | -0.2 | -0.3 | 0.4 | 0.6 | 1.7 |
| Net migration rate | per 1000 inhabit. | 0.7 | 1.3 | 3.2 | 3.1 | 7.1 | 9.2 |
| Total fertility rate | per 1000 inhabit. | 1.3 | 1.3 | 1.3 | 1.3 | 1.4 | 1.5 |
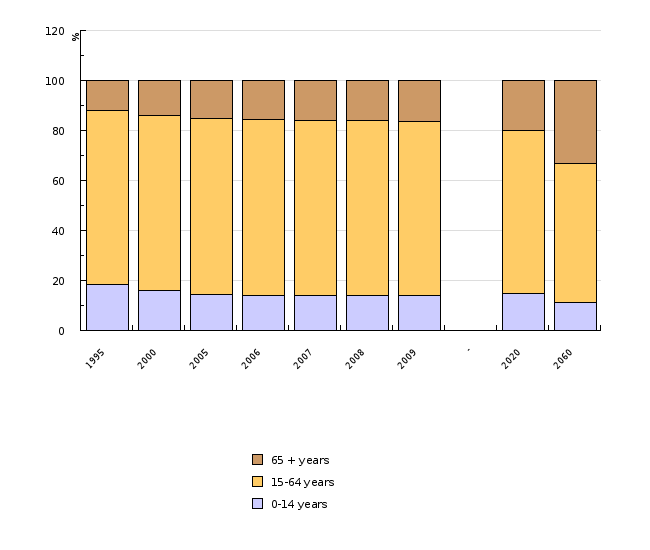
Figure SE02-3: Missing title
Sources:
SI-STAT podatkovni portal, Demografsko in socialno področje, 2010.
| 1995 | 2000 | 2005 | 2006 | 2007 | 2008 | 2009 | - | 2020 | 2060 | ||
|---|---|---|---|---|---|---|---|---|---|---|---|
| 0-14 years | num. | 368578 | 320374 | 286678 | 283221 | 281079 | 281081 | 284054 | 300000 | 200000 | |
| 15-64 years | num. | 1380754 | 1391981 | 1404428 | 1407263 | 1409667 | 1417938 | 1414279 | 1300000 | 1000000 | |
| 65 + years | num. | 240145 | 275400 | 306484 | 312874 | 319631 | 326847 | 334029 | 400000 | 600000 | |
| 0-14 years | % | 18.5 | 16.1 | 14.4 | 14.1 | 14 | 13.9 | 14 | 15 | 11.1 | |
| 15-64 years | % | 69.4 | 70 | 70.3 | 70.2 | 70.1 | 70 | 69.6 | 65 | 55.6 | |
| 65 + years | % | 12.1 | 13.9 | 15.3 | 15.6 | 15.9 | 16.1 | 16.4 | 20 | 33.3 | |
| Ageing index | index | 67 | 87.8 | 108.7 | 112.4 | 115.1 | 117.1 | 118 |
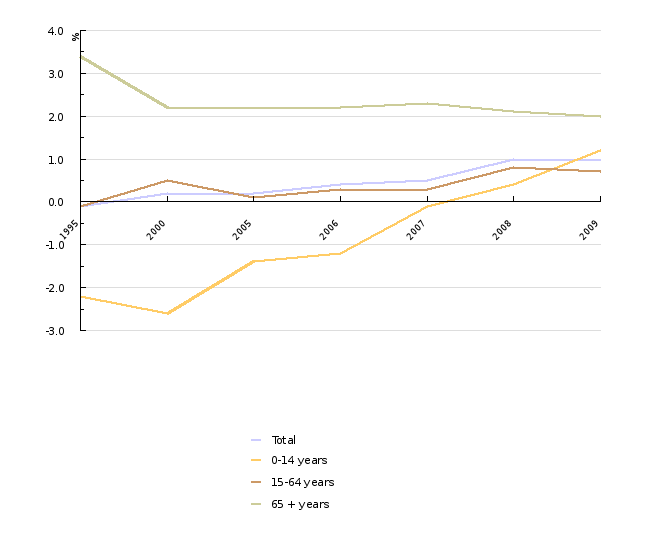
Figure SE02-4: Missing title
Sources:
SI-STAT podatkovni portal, Demografsko in socialno področje, 2010.
| 1995 | 2000 | 2005 | 2006 | 2007 | 2008 | 2009 | ||
|---|---|---|---|---|---|---|---|---|
| Total | % | -0.1 | 0.2 | 0.2 | 0.4 | 0.5 | 1 | 1 |
| 0-14 years | % | -2.2 | -2.6 | -1.4 | -1.2 | -0.1 | 0.4 | 1.2 |
| 15-64 years | % | -0.1 | 0.5 | 0.1 | 0.3 | 0.3 | 0.8 | 0.7 |
| 65 + years | % | 3.4 | 2.2 | 2.2 | 2.2 | 2.3 | 2.1 | 2 |
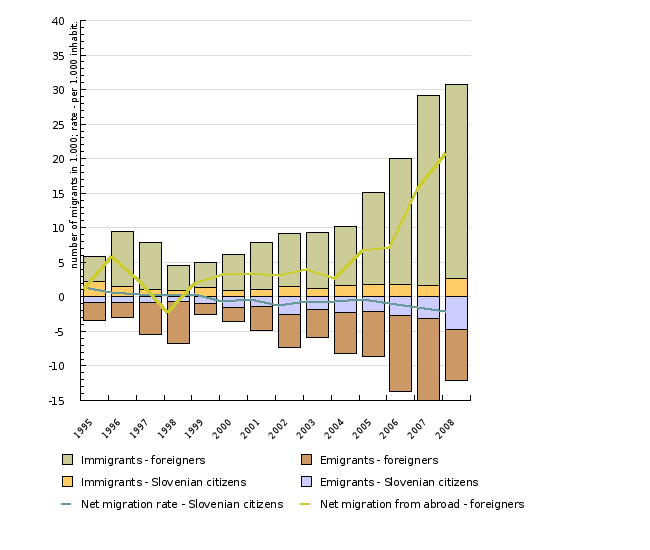
Figure SE02-5: Missing title
Sources:
SI-STAT podatkovni portal, Demografsko in socialno področje, 2010.
| 1995 | 1996 | 1997 | 1998 | 1999 | 2000 | 2001 | 2002 | 2003 | 2004 | ||
|---|---|---|---|---|---|---|---|---|---|---|---|
| Emigrants - Slovenian citizens | 1000 | -0.8 | -0.8 | -0.8 | -0.7 | -1 | -1.6 | -1.4 | -2.6 | -1.9 | -2.3 |
| Immigrants - Slovenian citizens | 1000 | 2.2 | 1.5 | 1.1 | 0.9 | 1.4 | 0.9 | 1 | 1.4 | 1.3 | 1.6 |
| Emigrants - foreigners | 1000 | -2.6 | -2.2 | -4.6 | -6 | -1.6 | -2 | -3.4 | -4.6 | -4 | -6 |
| Immigrants - foreigners | 1000 | 3.7 | 8 | 6.8 | 3.7 | 3.6 | 5.3 | 6.8 | 7.7 | 8 | 8.6 |
| Net migration rate - Slovenian citizens | per 1000 inhabit. | 1.4 | 0.7 | 0.3 | 0.2 | 0.4 | -0.6 | -0.4 | -1.2 | -0.6 | -0.7 |
| Net migration from abroad - foreigners | per 1000 inhabit. | 1.1 | 5.8 | 2.2 | -2.3 | 1.9 | 3.2 | 3.4 | 3.1 | 4 | 2.6 |
| Internal migration | 1000 | 25.7 | 28.7 | 29.3 | 30.1 | 30.5 | 29.8 | 31 | 34.9 | 27.8 | 30.2 |
| 2005 | 2006 | 2007 | 2008 | ||||||||
| Emigrants - Slovenian citizens | 1000 | -2.1 | -2.7 | -3.2 | -4.8 | ||||||
| Immigrants - Slovenian citizens | 1000 | 1.7 | 1.8 | 1.7 | 2.6 | ||||||
| Emigrants - foreigners | 1000 | -6.5 | -11 | -11.8 | -7.3 | ||||||
| Immigrants - foreigners | 1000 | 13.3 | 18.3 | 27.5 | 28.1 | ||||||
| Net migration rate - Slovenian citizens | per 1000 inhabit. | -0.3 | -0.9 | -1.5 | -2.1 | ||||||
| Net migration from abroad - foreigners | per 1000 inhabit. | 6.8 | 7.2 | 15.7 | 20.7 | ||||||
| Internal migration | 1000 | 32.2 | 38.5 | 38.6 | 106.2 |
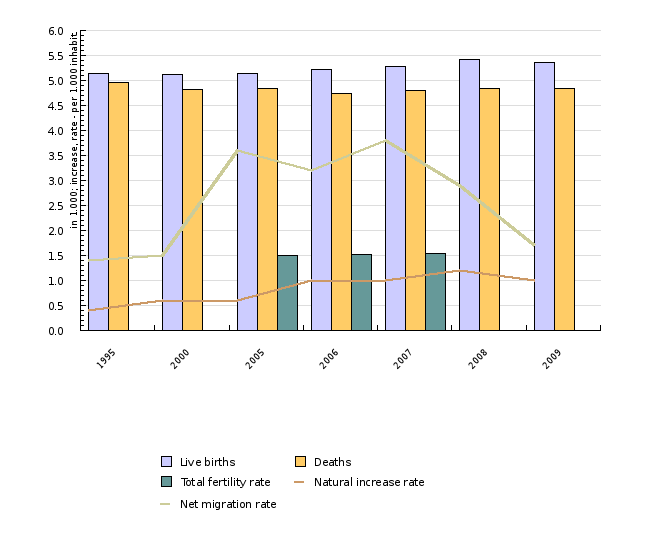
Figure SE02-6: Missing title
Sources:
EUROSTAT, Population and social conditions, 2010.
| 1995 | 2000 | 2005 | 2006 | 2007 | 2008 | 2009 | ||
|---|---|---|---|---|---|---|---|---|
| Live births | 1000 | 5.1 | 5.1 | 5.1 | 5.2 | 5.3 | 5.4 | 5.4 |
| Deaths | 1000 | 5 | 4.8 | 4.8 | 4.7 | 4.8 | 4.8 | 4.8 |
| Natural increase rate | per 1000 inhabit. | 0.4 | 0.6 | 0.6 | 1 | 1 | 1.2 | 1 |
| Net migration rate | per 1000 inhabit. | 1.4 | 1.5 | 3.6 | 3.2 | 3.8 | 2.9 | 1.7 |
| Total fertility rate | per 1000 inhabit. | 1.5 | 1.5 | 1.6 |


