[PP05] Changes in glacier extent

Key message

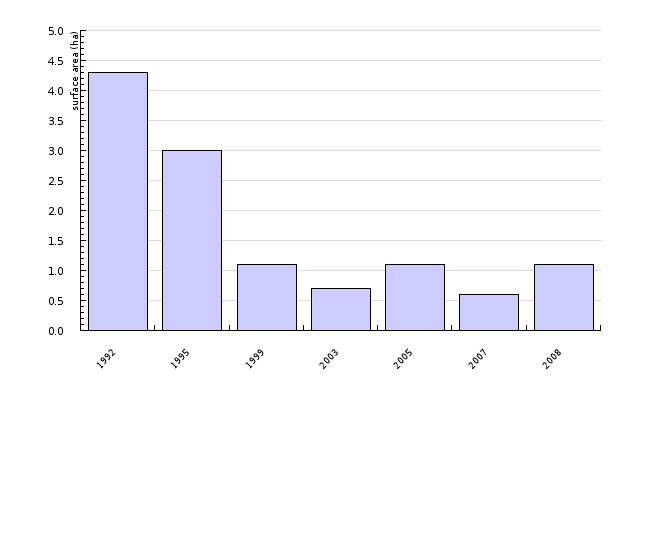
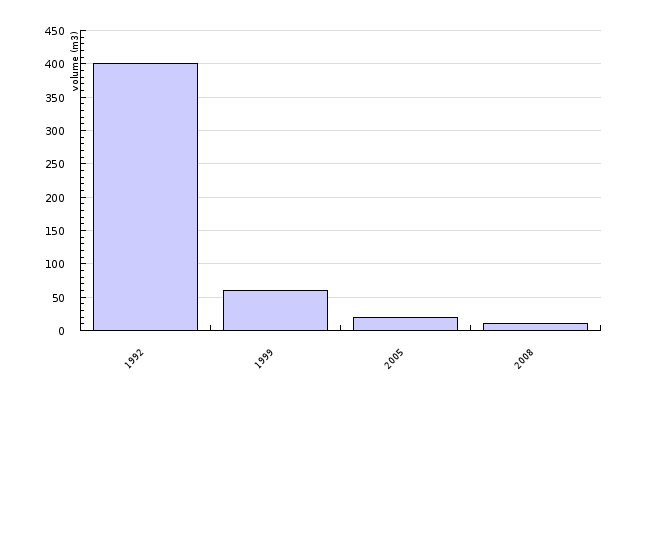
The shrinking of the Triglav glacier progressed during the 1990’s. The increasingly rapid thinning of the ice sheet caused individual rock formations to appear in the middle of the glacier, finally cutting it into two completely separate parts in 1992. Shrinking and disintegration of the Triglav glacier has not ceased; the process has only been brought to a standstill during years with above-average snow cover in the late spring.
Definition
The indicator shows changes in surface area and volume of the Triglav glacier. A glacier is a perennial mass of ice on the Earth’s surface, which moves downhill under its own weight in response to gravitational force. A glacier forms above the snow level, in locations where the mass accumulation of snow and ice exceeds ablation over many years. The snow is gradually transformed into ice glacier, which moves downhill reaching far down below the snow line. The key factors of ablation are: sun radiation, air temperature, precipitation and wind.
Changes in glacier volume and extent are an illustrative indicator of climate changes. During the last decade, the trend of rapid glacier retreat has been characteristic of all Alpine glaciers. In Slovenia, there are two glaciers: the Triglav glacier and the Skuta glacier. Due to their extreme southeastern position and low elevation above sea level, both are exceptionally sensitive to climate changes. Since the above-mentioned Slovenian glaciers are small, their relative shrinkage in respect to their present extent and volume is greater than is the case with other Alpine glaciers.
Charts
Anton Melik Geographical Institute at the Science and Research Centre of the Slovenian Academy of Sciences and Arts, 2007
| 1992 | 1995 | 1999 | 2003 | 2005 | 2007 | 2008 | ||
|---|---|---|---|---|---|---|---|---|
| surface | ha | 4.3 | 3 | 1.1 | 0.7 | 1.1 | 0.6 | 1.1 |
Anton Melik Geographical Institute at the Science and Research Centre of the Slovenian Academy of Sciences and Arts, 2009
| 1992 | 1999 | 2005 | 2008 | ||
|---|---|---|---|---|---|
| volume | m3 | 400 | 60 | 20 | 10 |
Anton Melik Geographical Institute at the Science and Research Centre of the Slovenian Academy of Sciences and Arts, 2006
Goals
Preparation of adjustment procedures to climatic conditions and mitigation of possible adverse effects.
Comment
Similar oscillations within the last 400 years are typical of all Alpine glaciers. Following the peak of the onset of the 17th century, glaciers remained at their maximum extents for the next 250 years, undergoing relatively insignificant changes. A majority of glaciers in the Eastern Alps reached their second peak between 1770 and 1780, and in the mid-19th century. However, the post-1920 period records a continuous retreat of glaciers; the only variations occurring between individual years and decades were those concerning the rate of glacier retreat. The shrinking of the Triglav glacier progressed during the 1990’s. The increasingly rapid thinning of the ice sheet caused individual rock formations to appear in the middle of the glacier, finally cutting it into two completely separate parts in 1992. The shrinking of the Triglav glacier is still continuing, with occasional halts in the process occurring in years with exceptionally high snow cover during late spring. The last time this occurred was in 2004, when, at the beginning of July, the snow measurement rod revealed more than 2 m of snow under the glacier. The snow cover remained in place until the end of melting season, so the glacier remained covered by snow and the measurements made no sense. The snow remained at the bottom of the glacier until the end of summer 2005, which is why the glacier’s surface in this year was greater than in 2003. The smallest glacier area was recorded in 2007, and measured 0.6 ha. At the end of the melting period in 2008, the glacier was still mainly covered with snow from the previous winter season, and its measured surface therefore amounted to 1.1 ha.
Similar trends are characteristic of all Alpine glaciers. The cause of rapidity in changes can be attributed to different elevations above sea level, position and glacier size.
Methodology
Data for Slovenia
Objectives summarized by: Resolution on National Environmental Action Programme 2005-2012 (ReNPVO, Official Gazette of the RS, No. 2/06).
Source database or source: Anton Melik Geographical Institute at the Science and Research Centre of the Slovenian Academy of Sciences and Arts, the data was obtained by geodetical measurements and photogrammetric survey.
Data administrator: Anton Melik Geographical Institute at the Science and Research Centre of the Slovenian Academy of Sciences and Arts
Data acquisition date for this indicator: 10 September 2009
Methodology and frequency of data collection for the indicator: The data is presented for the 1992-2008 period.
Data processing methodology: Measurements are carried out every year at the end of the melting period – the end of August or September. Classical geodetic measurements are taken through theodolite and/or photogrammetric survey.
Information concerning data quality:
- Advantages and disadvantages of the indicator: The data is comparable with the database of the World Glacier Monitoring Service based in Zürich.
- Relevance, accuracy, robustness, uncertainty: In years when the glacier is covered by snow at the end of the melting period, it is not possible to measure the extent of ice, but only of snow, which is why the glacier's extent and volume are overrated in those years. Due to weather conditions, measurements cannot be performed each year on the same day at the end of the melting period, so the extent of the glacier is not lowest on the same day each year.
Reliability of the indicator (archive data): The data is not published in any publicly available databases, but in various scientific and expert articles.
Uncertainty of the indicator (scenarios/projections): No scenarios, projections available
-Overall estimate (1 = no major remarks, 3 = data with reservation):
Relevance: 1
Accuracy: 1
Completeness over time:1
Completeness over space: 1
Ever since 1946, the Anton Melik Geographical Institute at the Science and Research Centre of the Slovenian Academy of Sciences and Arts conducts regular annual measurements of the Triglav and Skuta glaciers.
In 1946, measuring points were set up around the Triglav glacier from which the distance to the glacier was measured with measuring tape. On the basis of these measures, glacier drawings were made by individual year as along with assessments of the glacier's surface area. With the glacier retreating, several measuring points became too remote, and subsequent years saw the establishment of new ones. Given that the locations of all measuring points are geodetically measured, it has been possible all these years to make fairly accurate calculations of the glacier's surface area. Along with performing measurements, the expert team of the Anton Melik Geographical Institute also took regular photographs of the glacier from Begunjski vrh. Moreover, these photographs serve as an excellent source for the reconstruction of the glacier's extent throughout the past decades. Since 1976, there has also been a regular monthly photographing of the glacier from two fixed locations on Kredarica. As a rule, regular annual measurements are performed in mid-September, at the end of the melting period. In some years, however, measurements were rendered impossible by early snowfall.
In 1952, 1995 and 1999, the glacier was also measured geodetically. Since 1999, an airborne photogrammetric survey has been organised every second year. This photographic material has facilitated the calculations of changes in the glacier’s surface area and volume between individual years. In 2005, an airborne photogrammetric survey was organised, whereas in 2007 and 2008 terrestrial photogrammetric surveys were carried out.
In 1999 and 2001, geo-radar measurements were carried out for the provision of data on ice layer thickness by individual cross-section.
To calculate a glacier’s volume, we need information on its surface and its rocky base. Data on surface by individual year was obtained on the basis of photogrammetric survey in individual years, while the data on the rocky base was obtained from geo-radar measurements that were carried out in 2001. However, the data on the glacier’s rocky base in particular may be problematic or not precise enough due to its karstic diversity. Data on glacier volume is therefore only an estimation.
The World Glacier Monitoring Service based in Zurich collects data on glacier oscillations. In several glaciers, the series of data dates as far back as 1894.


