KAZALCI OKOLJA

Environmental indicators in Slovenia


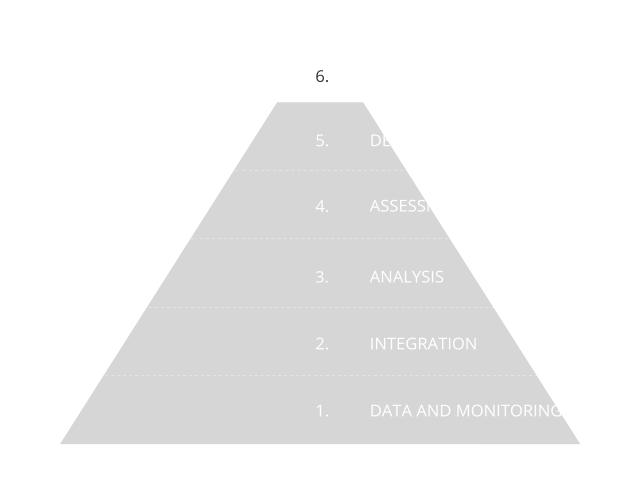
Environmental indicators are based on graphs, maps and assessments and as such present environmental trends in Slovenia. The indicators represent one of the four pillars of our environmental reporting, and are prepared in accordance with the Environmental Protection Act. The Environmental Indicators in Slovenia website enables users to browse among 180 indicators. They are based on numerical data and they indicate the state, characteristics and trends of environmental development in Slovenia. They are prepared using a systematic approach based on data and monitoring, as shown in the information pyramid.

Did you know?

Bad

The daily mobility of the population is a fundamental indicator of the performance and development trends of the transport system, and it also indirectly reflects the impact of the transport system on the environment - the greater the use of sustainable travel modes, the lower the impact of the transport system on the environment. In 2021, a resident of Slovenia made an average of 2.2 trips per day, the length of the trip was 31 km on average (27 km in the EU) and it took approximately 52 minutes (80 minutes in the EU).

Bad

Temperature in Slovenia is increasing faster than global average. Increase in the annual average temperature is most evident in the last three decades. Warming of the atmosphere will continue according to the climate change projections. The result of warming is an increase in sea level (due to melting of glaciers and thermal expansion), increase in level of the greenhouse gases in the atmosphere (contributes to warming), and many extreme weather and climate events (like floods, droughts, hail and heavy wind), which will influence the quality of our lives.

Good

Land areas, prepared for irrigation, have increased from 4,554 ha to 6,414 ha in the period 2000-2024, and their share in total utilized agricultural area from 0.9% to 1.3%. The water consumption per hectare of irrigated land, which strongly depends on weather conditions in each year, has decreased since 2000. Slovenia belongs to the group of EU countries with the smallest share of utilized agricultural area ready for irrigation.

Good

In the period 1992–2023 nitrogen surplus in Slovenian agriculture decreased. Trend analysis for this period shows that gross nitrogen surplus decreased on average by 1.4 kg N/ha per year or by 54%, and the net surplus by 1.2 kg N/ha per year or by 85%. The lower surplus was mainly due to a 43% increase in nitrogen removal by crops and a 6% decrease in nitrogen input per hectare of utilized agricultural area. A lower excess of nitrogen indicates better nitrogen management in agriculture and consequently a reduction in emissions of nitrogen compounds into the environment.

Neutral

2024 was the second consecutive year with above-average water abundance, with no surface water drought observed in any season. However, over the past twenty years, hydrological droughts of surface waters have become both more frequent and more intense compared to previous periods, with greater variability between individual years. Very dry and very wet years now alternate with periods of hydrologically normal conditions. The drought intensity during the growing season has become more frequent, though it has been less severe in the past decade than in the previous one.

Good

More than half of households in Slovenia have already used financial incentives for energy efficiency and renewable energy sources or are actively considering it. The index of household preferece for financial incentives offered by the Eco Fund increased positively by 4 index points from 2019 to 2022, when it was 52 on a scale from 0 to 100. Preference for these financial incentives varies between regions. On the one hand, knowledge and interest in the Eco Fund services is decreasing, while on the other hand, the share of households that have opted for these services again is increasing.