KAZALCI OKOLJA

Environmental indicators in Slovenia


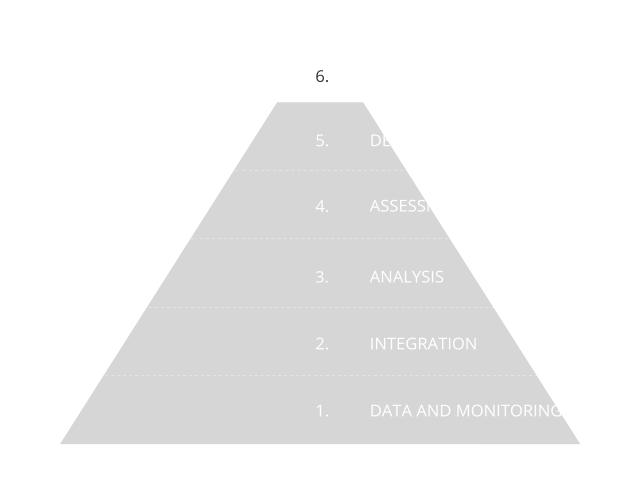
Environmental indicators are based on graphs, maps and assessments and as such present environmental trends in Slovenia. The indicators represent one of the four pillars of our environmental reporting, and are prepared in accordance with the Environmental Protection Act. The Environmental Indicators in Slovenia website enables users to browse among 180 indicators. They are based on numerical data and they indicate the state, characteristics and trends of environmental development in Slovenia. They are prepared using a systematic approach based on data and monitoring, as shown in the information pyramid.

Did you know?

Good

Most of industrial energy is consumed in the production of metals. In the period 2008-2012, the efficiency of energy use has increased, while the trends in individual sectors are very different and diverse.

Neutral

In 2022, the number of employees in the environmental goods and services sector increased by 4.2%. The share of employees in this sector in relation to all employees in Slovenia has not changed much in recent years. Slovenia's goal is to increase the number of green jobs, the target value has, however, not been set. In order to compare the situation in Slovenia with that in the EU, changes compared to the previous year are monitored.

Neutral

Incentives that go against the goal of reducing greenhouse gas (GHG) emissions have increased again after 2021, primarily due to extensive emergency measures introduced in response to rising energy prices. Excluding these temporary measures, the level of such subsidies in 2023 did not change significantly compared to 2020, with their value increasing by approximately 5.7%.

Neutral

Over the past decade, Slovenia has significantly improved its Eco-Innovation Index, mainly due to the growth in scientific publications, but it still remains slightly below the EU average, as the number of patents and exports of environmental goods and services has declined. Despite this progress, the gap with the EU stood at 4.7% in 2024.

Index includes 12 indicators from five thematic areas. Slovenia is ranked as an average eco-innovation performer. The target value for Slovenia has not been set.

Bad

Slovenia’s import dependence has been lower in recent years, amounting to 48% in 2023. Further increases in energy efficiency, the use of renewable sources, and the diversification of supply sources are essential. Slovenia is completely import-dependent for liquid fuels and natural gas. With regard to natural gas, Slovenia is import-dependent on two countries, Austria and Algeria. In the past, gas reaching Austria mostly came from Russia, but in recent years the supply structure has become more diversified due to the war and sanctions.


Bad

The share of renewable sources in total energy consumption was 18.4% in 2024. It remained unchanged compared to the previous year. The growth of RES is very slow and insufficient to achieve the targets in this area.