KAZALCI OKOLJA

Environmental indicators in Slovenia


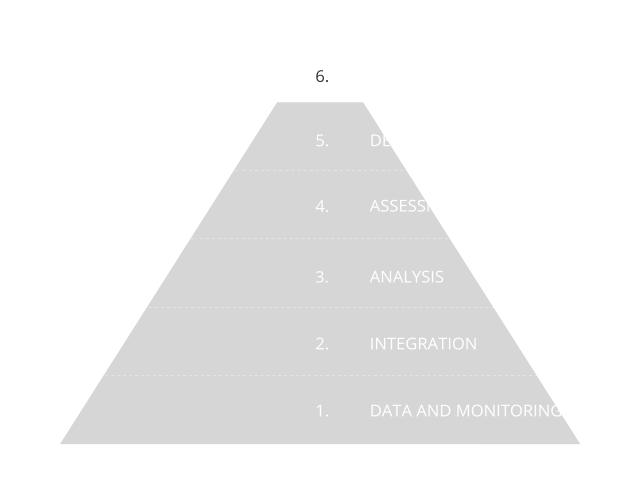
Environmental indicators are based on graphs, maps and assessments and as such present environmental trends in Slovenia. The indicators represent one of the four pillars of our environmental reporting, and are prepared in accordance with the Environmental Protection Act. The Environmental Indicators in Slovenia website enables users to browse among 180 indicators. They are based on numerical data and they indicate the state, characteristics and trends of environmental development in Slovenia. They are prepared using a systematic approach based on data and monitoring, as shown in the information pyramid.

Did you know?

Neutral

Comparison of periods 1961–1990 and 1991–2020 on the chosen representative stations around Slovenia shows decrease of heating degree days by around 10 % and multiple increase of cooling degree days. With projected continuous temperature raise until the end of 21st century, those trends are expected to continue. Thus, in Slovenia, energy demand for cooling will increase in the warmer period of the year, while the energy demand for heating will decrease in colder period of the year. Same trend is projected for Europe in general.

Good

From 2012 to 2023, the installed capacity of the systems for the production of electricity from RES has increased by 78,5%. Almost two-thirds of that increase, 51,2%, was achieved in the last four years. The indicator is currently on a trajectory of achieving the indicative targets until 2030 set in the National Energy and Climate Plan (NECP).

Bad

With the increasing share of electric passenger vehicles, CO2 emissions decreased in 2022 and 2023, but increased slightly in 2024 compared to the previous year due to the decrease in the share. The gap to the target value is almost 34%.

The average emissions of all passenger vehicles increased in 2022 compared to the previous year. In 2023, the average emissions decreased back to approximately the level of 2021. The target values were not achieved.

Neutral

In 2023, 65% of the population was connected to municipal wastewater treatment systems with secondary or tertiary treatment, which do not produce GHG emissions. Compared to the previous year, the share increased slightly, and compared to 2017, it rose by 3.5 percentage points.

Bad

The intensity of GHG emissions from fuels and energy in transport in Slovenia was 4.7% lower than the baseline in 2021, which is 1.3 percentage points below the target reduction. Although the intensity is decreasing, the pace is too slow. The largest contribution to reducing intensity comes from the blending of biofuels. In the EU, the largest reductions were achieved by Sweden and Finland, along with 11 other countries that achieved reductions of 6% or more.

Bad

The share of renewable sources in total energy consumption was 18.4% in 2024. It remained unchanged compared to the previous year. The growth of RES is very slow and insufficient to achieve the targets in this area.