KAZALCI OKOLJA

Environmental indicators in Slovenia


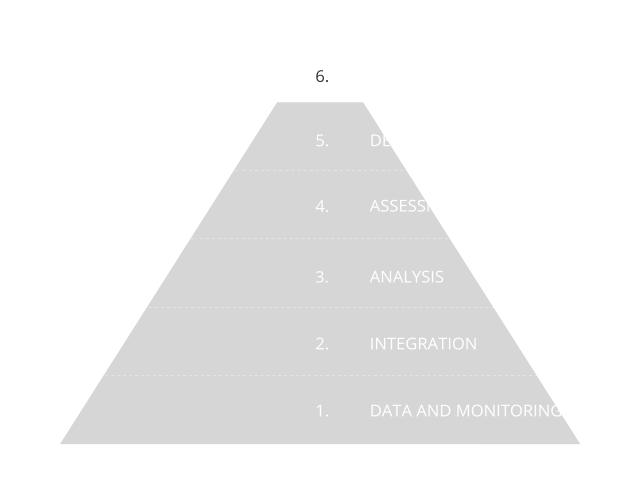
Environmental indicators are based on graphs, maps and assessments and as such present environmental trends in Slovenia. The indicators represent one of the four pillars of our environmental reporting, and are prepared in accordance with the Environmental Protection Act. The Environmental Indicators in Slovenia website enables users to browse among 180 indicators. They are based on numerical data and they indicate the state, characteristics and trends of environmental development in Slovenia. They are prepared using a systematic approach based on data and monitoring, as shown in the information pyramid.

Did you know?

Good

Households willingness to use photovoltaic systems in single-family homes has increased. The index increased by 7 index points between 2019 and 2022, reaching a value of 36 on a scale from 0 to 100 in 2022. The share of households that already use or intend to use photovoltaics in the near future has increased the most during this period. Despite the positive change, as many as a quarter of households are still hesitant or reluctant to use photovoltaics. There are no differences in willingness to use photovoltaics between regions.

Neutral

The implicit tax rate on energy in Slovenia amounted to 250 €/toe in 2024, which is 1% higher than in the previous year but still 15% lower than in 2016, when it reached its peak in the 2012–2024 period. Compared to the EU-27, it was 0,7 % above the EU average in 2024, while it was below the European average only in the years 2020–2022 due to temporary crisis-related measures. In addition to the tax policy, the rate is also influenced by changes in the structure of energy consumption and energy efficiency.

Neutral

In 2024, 67% of the population was connected to municipal wastewater treatment systems with secondary or tertiary treatment that cause minimal GHG emissions. Compared to the previous year, the share increased by almost 2 percentage points. Compared to 2017, the share increased by 5.4 percentage points.

Neutral

By 2025, the implementation of energy efficiency (EE) and renewable energy measures (RES) in the public sector resulted in total annual energy savings of 365 GWh, and the total annaul CO2 emissions reduction was 92 kt. Investment activity declined in 2025 due to the transition from one financial perspective to the other. In that year, energy savings amounted to 16.8 GWh and the CO2 emissions reduction was 5.3 kt, which are the lowest levels recorded in the 2018–2025 period. No 2030 targets have been set for this indicator.

Good

In 2024, 83.1% of all heat in district heating (DH) systems was produced in energy-efficient district heating systems, i.e. systems meeting at least one of the criteria defined in Article 50 of the Energy Efficiency Act (ZURE). Compared with 2023, this share decreased by 4.5 percentage points. The combined share of heat from renewable energy sources and waste heat amounted to 20.5% in 2024, which was 0.7 percentage points lower than in the previous year, but 4.8 percentage points higher than in 2016.

Good

From 2012 to 2024, the installed capacity of the systems for the production of electricity from RES has increased by 78,5%. More than three quarters of that increase, 77,2%, was achieved in the last five years. The indicator is currently on a trajectory of achieving the annual indicative values until 2030 set in the National Energy and Climate Plan from 2024 (NECP 2024).