[PR06] Public awareness about the effects of transport on the environment

Key message

Inhabitants of the EU-27, including Slovenia, are only partially aware of the problem of increasing volume of transport and its environmental consequences. Public awareness about the effects of transport on the environment is still at a relatively low level, although differences between European countries are substantial. People's awareness of environmental problems caused by transport does not automatically lead to changing mobility habits and is not always reflected in changed behaviour of the population.
Definition
This indicator shows the travel habits of the Slovenian and European population, the rate of sustainable mobility, people’s attitude towards various modes of transport and the modal split of passenger transport. Indirectly, the indicator shows the awareness of the European and Slovenian population about the effects of transport on the environment, which is mainly reflected through the perception of the intensity of key problems related to various modes of transport. The indicator is based on a survey conducted in October 2014 by the European Commission, Directorate-General for Mobility and Transport.
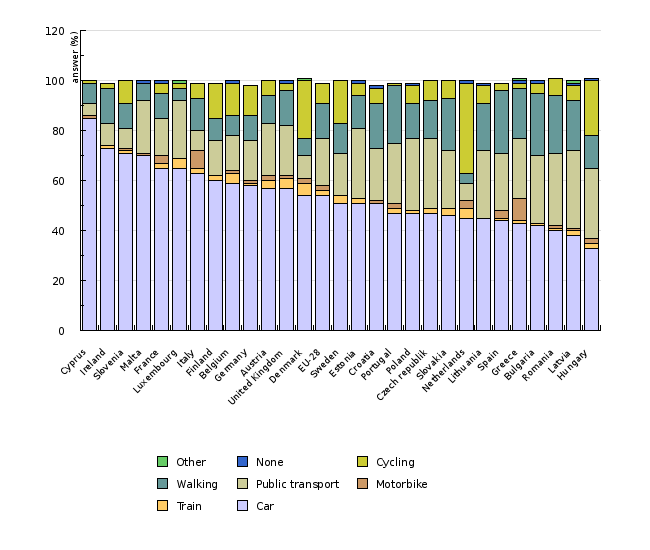
Charts
European Commission, Special barometer (422a) "Quality of transport”, 2014.
| Cyprus | Ireland | Slovenia | Malta | France | Luxembourg | Italy | Finland | Belgium | Germany | ||
|---|---|---|---|---|---|---|---|---|---|---|---|
| Car | % | 85 | 73 | 71 | 70 | 65 | 65 | 63 | 60 | 59 | 58 |
| Train | % | 0 | 1 | 1 | 0 | 2 | 4 | 2 | 2 | 4 | 1 |
| Motorbike | % | 1 | 0 | 1 | 1 | 3 | 0 | 7 | 0 | 1 | 1 |
| Public transport | % | 5 | 9 | 8 | 21 | 15 | 23 | 8 | 14 | 14 | 16 |
| Walking | % | 8 | 14 | 10 | 7 | 10 | 5 | 13 | 9 | 8 | 10 |
| Cycling | % | 1 | 2 | 9 | 0 | 4 | 2 | 6 | 14 | 13 | 12 |
| None | % | 0 | 0 | 0 | 1 | 1 | 0 | 0 | 0 | 1 | 0 |
| Other | % | 0 | 0 | 0 | 0 | 0 | 1 | 0 | 0 | 0 | 0 |
| Austria | United Kingdom | Denmark | EU-28 | Sweden | Estonia | Croatia | Portugal | Poland | Czech republik | ||
| Car | % | 57 | 57 | 54 | 54 | 51 | 51 | 51 | 47 | 47 | 47 |
| Train | % | 3 | 4 | 5 | 2 | 3 | 2 | 0 | 2 | 1 | 2 |
| Motorbike | % | 2 | 1 | 2 | 2 | 0 | 0 | 1 | 2 | 0 | 0 |
| Public transport | % | 21 | 20 | 9 | 19 | 17 | 28 | 21 | 24 | 29 | 28 |
| Walking | % | 11 | 14 | 7 | 14 | 12 | 13 | 18 | 23 | 14 | 15 |
| Cycling | % | 6 | 3 | 23 | 8 | 17 | 5 | 6 | 1 | 7 | 8 |
| None | % | 0 | 1 | 0 | 0 | 0 | 1 | 1 | 0 | 1 | 0 |
| Other | % | 0 | 0 | 1 | 0 | 0 | 0 | 0 | 0 | 0 | 0 |
| Slovakia | Netherlands | Lithuania | Spain | Greece | Bulgaria | Romania | Latvia | Hungary | |||
| Car | % | 46 | 45 | 45 | 44 | 43 | 42 | 40 | 38 | 33 | |
| Train | % | 3 | 4 | 0 | 1 | 1 | 1 | 1 | 2 | 2 | |
| Motorbike | % | 0 | 3 | 0 | 3 | 9 | 0 | 1 | 1 | 2 | |
| Public transport | % | 23 | 7 | 27 | 23 | 24 | 27 | 29 | 31 | 28 | |
| Walking | % | 21 | 4 | 19 | 25 | 20 | 25 | 23 | 20 | 13 | |
| Cycling | % | 7 | 36 | 7 | 3 | 2 | 4 | 7 | 6 | 22 | |
| None | % | 0 | 1 | 1 | 0 | 1 | 1 | 0 | 1 | 1 | |
| Other | % | 0 | 0 | 0 | 0 | 1 | 0 | 0 | 1 | 0 |
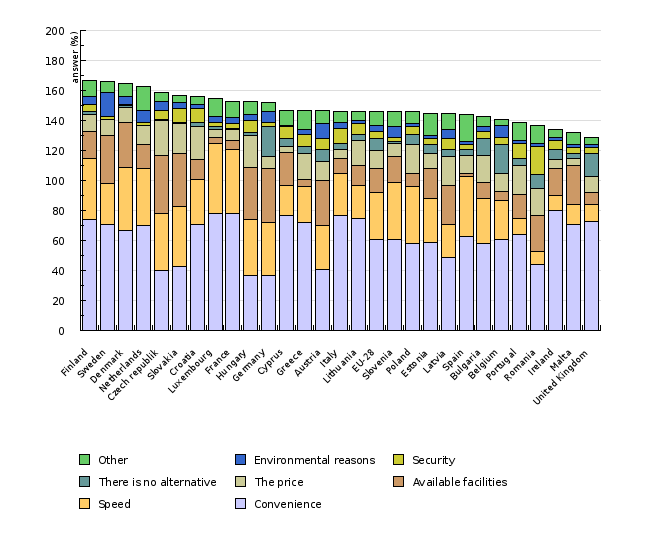
European Commission, Special barometer (422a) "Quality of transport”, 2014.
*Note: This question was answered only by respondents who use a mode of transport (N= 27,678).
| Finland | Sweden | Denmark | Netherlands | Czech republik | Slovakia | Croatia | Luxembourg | France | Hungary | ||
|---|---|---|---|---|---|---|---|---|---|---|---|
| Convenience | % | 74 | 71 | 67 | 70 | 40 | 43 | 71 | 78 | 78 | 37 |
| Speed | % | 41 | 27 | 42 | 38 | 38 | 40 | 30 | 47 | 43 | 37 |
| Available facilities | % | 18 | 32 | 30 | 16 | 39 | 35 | 13 | 4 | 6 | 35 |
| The price | % | 11 | 11 | 10 | 13 | 23 | 20 | 22 | 5 | 7 | 21 |
| There is no alternative | % | 2 | 0 | 1 | 0 | 1 | 1 | 3 | 2 | 1 | 2 |
| Security | % | 5 | 2 | 1 | 2 | 6 | 9 | 9 | 3 | 3 | 8 |
| Environmental reasons | % | 5 | 16 | 5 | 8 | 6 | 4 | 3 | 4 | 4 | 4 |
| Other | % | 11 | 7 | 9 | 16 | 6 | 5 | 5 | 12 | 11 | 9 |
| Germany | Cyprus | Greece | Austria | Italy | Lithuania | EU-28 | Slovenia | Poland | Estonia | ||
| Convenience | % | 37 | 77 | 72 | 41 | 77 | 75 | 61 | 61 | 58 | 59 |
| Speed | % | 35 | 20 | 24 | 29 | 28 | 22 | 31 | 38 | 38 | 29 |
| Available facilities | % | 36 | 22 | 5 | 30 | 10 | 13 | 16 | 17 | 9 | 20 |
| The price | % | 8 | 4 | 17 | 13 | 6 | 17 | 12 | 9 | 19 | 10 |
| There is no alternative | % | 20 | 5 | 5 | 8 | 4 | 4 | 8 | 1 | 7 | 6 |
| Security | % | 3 | 8 | 8 | 7 | 10 | 7 | 5 | 3 | 5 | 4 |
| Environmental reasons | % | 7 | 1 | 3 | 10 | 4 | 2 | 4 | 7 | 2 | 2 |
| Other | % | 6 | 10 | 13 | 9 | 7 | 6 | 9 | 10 | 8 | 15 |
| Latvia | Spain | Bulgaria | Belgium | Portugal | Romania | Ireland | Malta | United Kingdom | |||
| Convenience | % | 49 | 63 | 58 | 61 | 64 | 44 | 80 | 71 | 73 | |
| Speed | % | 22 | 40 | 30 | 26 | 11 | 9 | 10 | 13 | 11 | |
| Available facilities | % | 26 | 2 | 11 | 6 | 16 | 24 | 18 | 26 | 8 | |
| The price | % | 19 | 12 | 18 | 12 | 19 | 18 | 6 | 5 | 11 | |
| There is no alternative | % | 5 | 4 | 11 | 19 | 5 | 9 | 7 | 3 | 15 | |
| Security | % | 7 | 3 | 5 | 5 | 10 | 19 | 6 | 4 | 4 | |
| Environmental reasons | % | 6 | 2 | 3 | 8 | 2 | 2 | 2 | 2 | 2 | |
| Other | % | 11 | 18 | 7 | 4 | 12 | 12 | 5 | 8 | 5 |
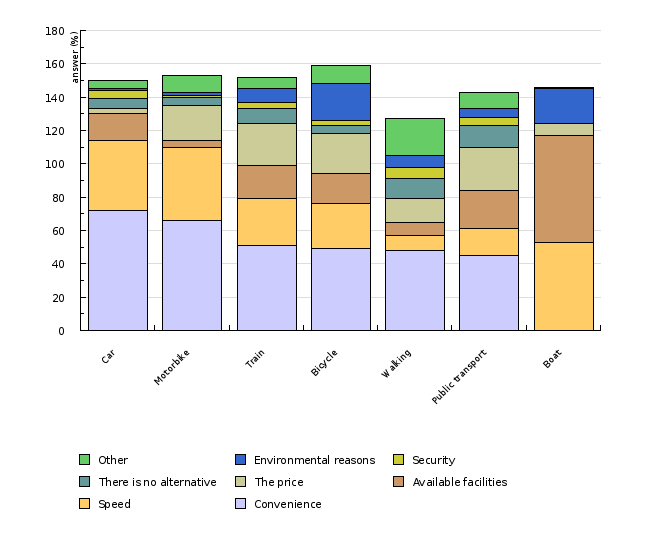
European Commission, Special barometer (422a) "Quality of transport”, 2014.
*Note: This question was answered only by respondents who use a mode of transport (N= 27,678). Choice of up to 2 answers was possible. Featured are only the answers for EU-28.
| Car | Motorbike | Train | Bicycle | Walking | Public transport | Boat | ||
|---|---|---|---|---|---|---|---|---|
| Convenience | % | 72 | 66 | 51 | 49 | 48 | 45 | 0 |
| Speed | % | 42 | 44 | 28 | 27 | 9 | 16 | 53 |
| Available facilities | % | 16 | 4 | 20 | 18 | 8 | 23 | 64 |
| The price | % | 3 | 21 | 25 | 24 | 14 | 26 | 7 |
| There is no alternative | % | 6 | 5 | 9 | 5 | 12 | 13 | 0 |
| Security | % | 5 | 1 | 4 | 3 | 7 | 5 | 0 |
| Environmental reasons | % | 1 | 2 | 8 | 22 | 7 | 5 | 21 |
| Other | % | 5 | 10 | 7 | 11 | 22 | 10 | 1 |
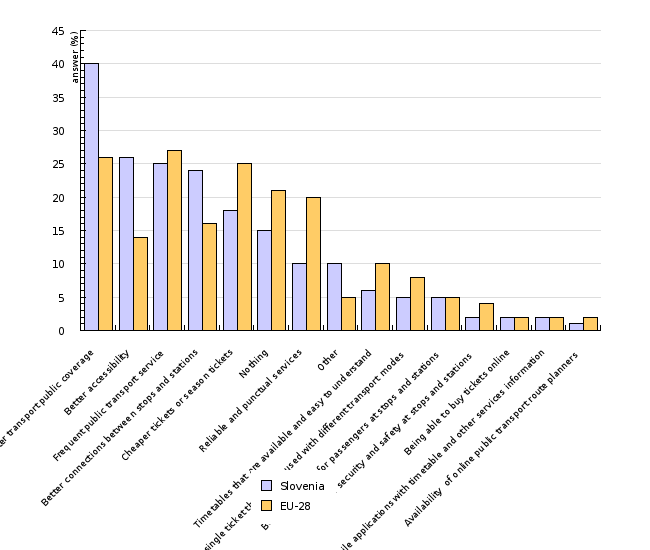
European Commission, Special barometer (422a) "Quality of transport”, 2014.
*Note:Featured are only the anwers for EU-28. This question was answered only by respondents who use passenger car of motorcycle. There were maximum 3 answers possible.
| Better transport public coverage | Better accessibility | Frequent public transport service | Better connections between stops and stations | Cheaper tickets or season tickets | Nothing | Reliable and punctual services | Other | Timetables that are available and easy to understand | Being able to buy single ticket that can be used with different transport modes | ||
|---|---|---|---|---|---|---|---|---|---|---|---|
| Slovenia | % | 40 | 26 | 25 | 24 | 18 | 15 | 10 | 10 | 6 | 5 |
| EU-28 | % | 26 | 14 | 27 | 16 | 25 | 21 | 20 | 5 | 10 | 8 |
| Better amenities for passengers at stops and stations | Improved security and safety at stops and stations | Being able to buy tickets online | Availability of mobile applications with timetable and other services information | Availability of online public transport route planners | |||||||
| Slovenia | % | 5 | 2 | 2 | 2 | 1 | |||||
| EU-28 | % | 5 | 4 | 2 | 2 | 2 |
European Commission, Special barometer (422a) "Quality of transport”, 2014.
*Note: This question was answered only by respondents who made a journey of 300 km or more during the last 12 months (N= 16,471). The were many answers possible.
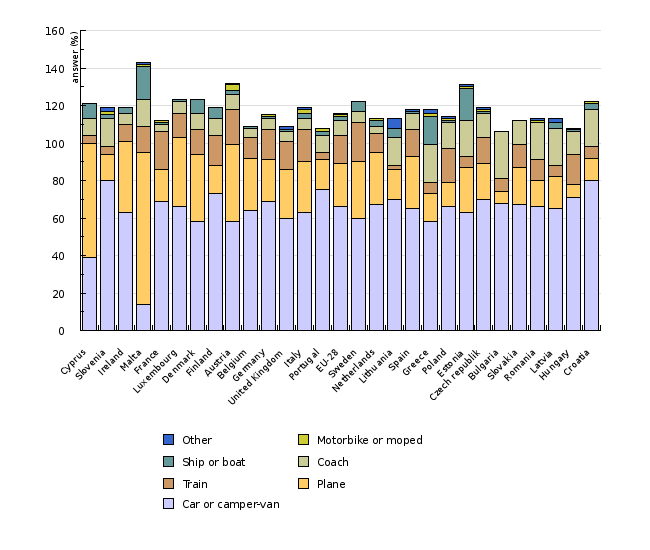
| Cyprus | Slovenia | Ireland | Malta | France | Luxembourg | Denmark | Finland | Austria | Belgium | ||
|---|---|---|---|---|---|---|---|---|---|---|---|
| Car or camper-van | % | 39 | 80 | 63 | 14 | 69 | 66 | 58 | 73 | 58 | 64 |
| Plane | % | 61 | 14 | 38 | 81 | 17 | 37 | 36 | 15 | 41 | 28 |
| Train | % | 4 | 4 | 9 | 14 | 20 | 13 | 13 | 16 | 19 | 11 |
| Coach | % | 9 | 15 | 6 | 14 | 4 | 6 | 9 | 9 | 8 | 5 |
| Ship or boat | % | 8 | 2 | 3 | 18 | 1 | 1 | 7 | 6 | 2 | 1 |
| Motorbike or moped | % | 0 | 2 | 0 | 1 | 1 | 0 | 0 | 0 | 3 | 0 |
| Other | % | 0 | 2 | 0 | 1 | 0 | 0 | 0 | 0 | 1 | 0 |
| Germany | United Kingdom | Italy | Portugal | EU-28 | Sweden | Netherlands | Lithuania | Spain | Greece | ||
| Car or camper-van | % | 69 | 60 | 63 | 75 | 66 | 60 | 67 | 70 | 65 | 58 |
| Plane | % | 22 | 26 | 27 | 16 | 23 | 30 | 28 | 16 | 28 | 15 |
| Train | % | 16 | 15 | 17 | 4 | 15 | 21 | 10 | 2 | 14 | 6 |
| Coach | % | 6 | 5 | 6 | 9 | 8 | 6 | 4 | 15 | 9 | 20 |
| Ship or boat | % | 1 | 1 | 3 | 2 | 2 | 5 | 3 | 5 | 1 | 15 |
| Motorbike or moped | % | 1 | 0 | 2 | 2 | 1 | 0 | 1 | 0 | 0 | 2 |
| Other | % | 0 | 2 | 1 | 0 | 1 | 0 | 0 | 5 | 1 | 2 |
| Poland | Estonia | Czech republik | Bulgaria | Slovakia | Romania | Latvia | Hungary | Croatia | |||
| Car or camper-van | % | 66 | 63 | 70 | 68 | 67 | 66 | 65 | 71 | 80 | |
| Plane | % | 13 | 24 | 19 | 6 | 20 | 14 | 17 | 7 | 12 | |
| Train | % | 18 | 6 | 14 | 7 | 12 | 11 | 6 | 16 | 6 | |
| Coach | % | 14 | 19 | 13 | 25 | 13 | 20 | 20 | 12 | 20 | |
| Ship or boat | % | 1 | 17 | 1 | 0 | 0 | 0 | 3 | 1 | 3 | |
| Motorbike or moped | % | 1 | 1 | 1 | 0 | 0 | 1 | 0 | 0 | 1 | |
| Other | % | 1 | 1 | 1 | 0 | 0 | 1 | 2 | 1 | 0 |
European Commission, Special Eurobarometer (422a) "Quality of transport”, 2014
*Note: This question was answered only by respondents who made a journey of 300 km or more during the last 12 months (N= 16,471). The were maximum 2 answers possible.
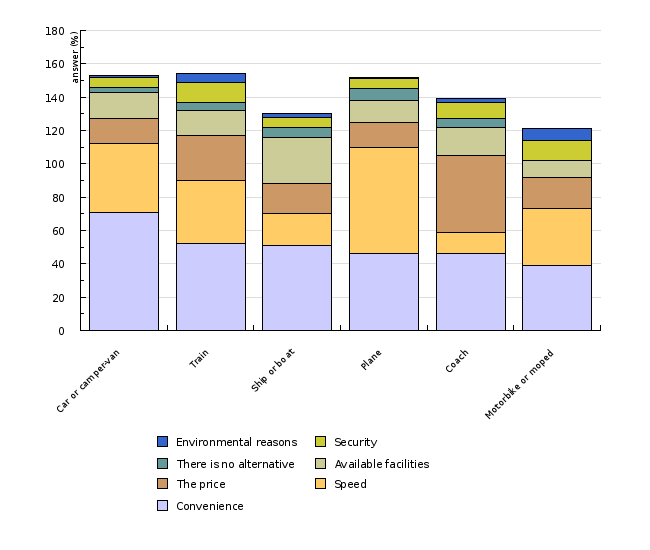
| Car or camper-van | Train | Ship or boat | Plane | Coach | Motorbike or moped | ||
|---|---|---|---|---|---|---|---|
| Convenience | % | 71 | 52 | 51 | 46 | 46 | 39 |
| Speed | % | 41 | 38 | 19 | 64 | 13 | 34 |
| The price | % | 15 | 27 | 18 | 15 | 46 | 19 |
| Available facilities | % | 16 | 15 | 28 | 13 | 17 | 10 |
| There is no alternative | % | 3 | 5 | 6 | 7 | 5 | 0 |
| Security | % | 6 | 12 | 6 | 6 | 10 | 12 |
| Environmental reasons | % | 1 | 5 | 2 | 1 | 2 | 7 |
European Commission, Special Eurobarometer (422a) "Quality of transport”, 2014
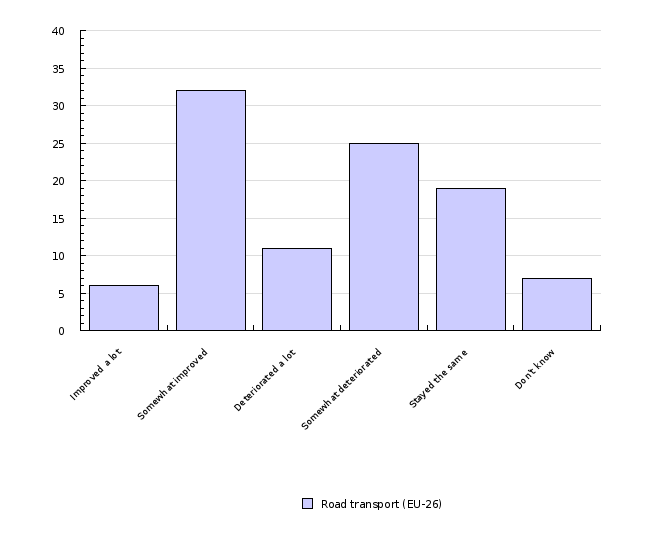
| Improved a lot | Somewhat improved | Deteriorated a lot | Somewhat deteriorated | Stayed the same | Don't know | ||
|---|---|---|---|---|---|---|---|
| Road transport (EU-26) | % | 6 | 32 | 11 | 25 | 19 | 7 |
European Commission, Special Eurobarometer (422a) "Quality of transport”, 2014
*Note: Value 0 means the specific problem does not reffer to this mode of transport. Maximum 3 answers were possible.
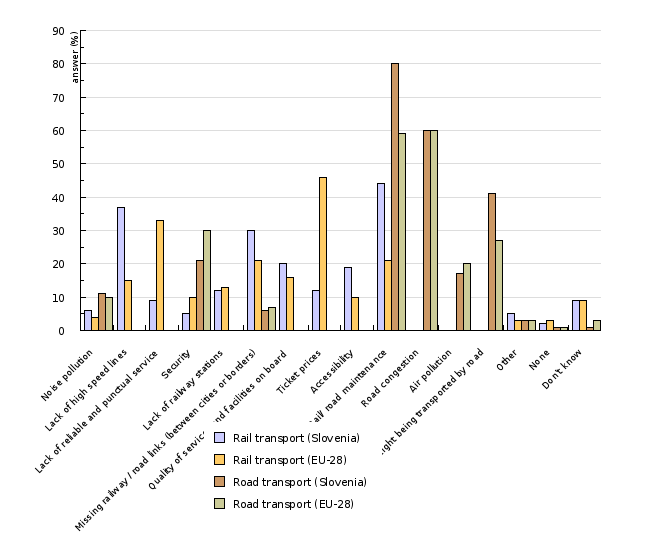
| Noise pollution | Lack of high speed lines | Lack of reliable and punctual service | Security | Lack of railway stations | Missing railway / road links (between cities or borders) | Quality of services and facilities on board | Ticket prices | Accessibility | Rail/ road maintenance | ||
|---|---|---|---|---|---|---|---|---|---|---|---|
| Rail transport (Slovenia) | % | 6 | 37 | 9 | 5 | 12 | 30 | 20 | 12 | 19 | 44 |
| Rail transport (EU-28) | % | 4 | 15 | 33 | 10 | 13 | 21 | 16 | 46 | 10 | 21 |
| Road transport (Slovenia) | % | 11 | 0 | 0 | 21 | 0 | 6 | 0 | 0 | 0 | 80 |
| Road transport (EU-28) | % | 10 | 0 | 0 | 30 | 0 | 7 | 0 | 0 | 0 | 59 |
| Road congestion | Air pollution | The amount of freight being transported by road | Other | None | Don't know | ||||||
| Rail transport (Slovenia) | % | 0 | 0 | 0 | 5 | 2 | 9 | ||||
| Rail transport (EU-28) | % | 0 | 0 | 0 | 3 | 3 | 9 | ||||
| Road transport (Slovenia) | % | 60 | 17 | 41 | 3 | 1 | 1 | ||||
| Road transport (EU-28) | % | 60 | 20 | 27 | 3 | 1 | 3 |
European Commission, Special Eurobarometer (422a) "Quality of transport”, 2014
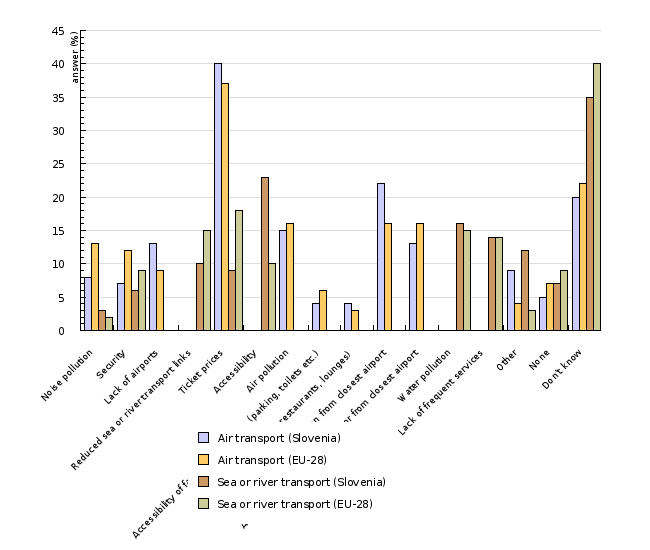
*Note: Value 0 means the specific problem does not reffer to this mode of transport. Maximum 3 answers were possible.
| Noise pollution | Security | Lack of airports | Reduced sea or river transport links | Ticket prices | Accessibility | Air pollution | Accessibility of facilities at airports (parking, toilets etc.) | Airport services (shops, restaurants, lounges) | Lack of destination from closest airport | ||
|---|---|---|---|---|---|---|---|---|---|---|---|
| Air transport (Slovenia) | % | 8 | 7 | 13 | 0 | 40 | 0 | 15 | 4 | 4 | 22 |
| Air transport (EU-28) | % | 13 | 12 | 9 | 0 | 37 | 0 | 16 | 6 | 3 | 16 |
| Sea or river transport (Slovenia) | % | 3 | 6 | 0 | 10 | 9 | 23 | 0 | 0 | 0 | 0 |
| Sea or river transport (EU-28) | % | 2 | 9 | 0 | 15 | 18 | 10 | 0 | 0 | 0 | 0 |
| Avaibility of public transport to or from closest airport | Water pollution | Lack of frequent services | Other | None | Don't know | ||||||
| Air transport (Slovenia) | % | 13 | 0 | 0 | 9 | 5 | 20 | ||||
| Air transport (EU-28) | % | 16 | 0 | 0 | 4 | 7 | 22 | ||||
| Sea or river transport (Slovenia) | % | 0 | 16 | 14 | 12 | 7 | 35 | ||||
| Sea or river transport (EU-28) | % | 0 | 15 | 14 | 3 | 9 | 40 |
Goals
- To enhance public information provision, awareness and education on environmental policy.
(General Union Environment Action Programme to 2020 ‘Living well, within the limits of our planet’)
- To raise awareness and inform various target groups on sustainable mobility and awareness raising about available alternatives to conventional modes of individual passenger transport
- To raise people's environmental awareness and change travel habits in cities through measures to promote walking, cycling and the use of public transport and by promoting sustainable multi-modal urban mobility.
- To increase mobility by including service users in integral public transport, whose attractive prices and quality of service will stimulate passengers to switch from private to public passenger transport
- To establish an efficient system of rail and bus public passenger transport
- To carry out financially undemanding measures to increase mobility, with particular focus on the initiative to develop a network of cycling infrastructure.
- Transport policy measures in the fields of increasing mobility and promoting the development of the cycling and pedestrian infrastructure network should result in an increase in the length of uninterrupted cycling trails, an increased number of users of public passenger transport and reduced air pollution in city centres.
Comment
According to the European Environment Agency, people’s dissatisfaction with transport is considerable. Most often, excessive volumes of traffic and air pollution are perceived as the main negative effects of transport, while landscape degradation and noise are seen as less problematic, with the percentage of people complaining about the latter two decreasing (trend estimate 1992 – 2002) (EEA, 2004; EEA, 2015).
More than half of interviewees who participated in the EU-28 survey use passenger cars for their daily needs. In Slovenia, 71% of interviewees responded that they use passenger cars for their everyday needs, while only 8% use public transport. This ranks Slovenia at the bottom of the EU-28 countries when it comes to using sustainable transport modes. The rate of passenger car use is higher only in Cyprus and Ireland. The average percentage of car use in passenger transport in the EU-28 was 54%.
Below-average rate of use of passenger cars was mostly characteristic of eastern European countries. Hungary had the lowest rate of passenger car use (33%). In Hungary, 28% of interviewees use public transport, while 22% cycle. In 2014, the highest share in the use of passenger transport was recorded in Latvia, Poland and Romania. With an 8% share, Slovenia is ranked 25th among the EU-28 countries. Only Cyprus and the Netherlands have a lower share in the use of public transport. Nevertheless, the situation is not concerning in the Netherlands, as 36% of the population use bicycles on a regular basis. Only Hungary and Denmark have higher shares of bicycle use.
In Slovenia, as well as Europe, the prevalence of the use of individual transport (passenger car, camper) is characteristic when it comes to longer trips. The share of people who used passenger cars or campers for trips longer than 300 km averaged 66% in the EU-28, while in Slovenia, it was 80%. Other transport modes were used to a lesser extent for long-distance trips – most often, interviewees chose air transport (23% on average).
In Slovenia, as well as in other European countries, the most common reason (61% of interviewees) for selecting the above-mentioned transport modes was comfort. The share of interviewees who indicated comfort as the main reason for their choice of transport was highest in France and Luxembourg (78%) and lowest in Germany (37%), while Slovenia equalled the European average. The second most important reason (the EU-28 average of 31% interviewees) for selecting a certain mode of transport was travel speed (or duration). Only 4% of interviewees, however, indicated environmental reasons or the prevention of negative impacts of transport on the environment for their choice of transport. This reveals a relatively low awareness of the European public as regards the impact of transport on the environment, or low environmental engagement, which would be reflected in the selection of sustainable transport modes.
In Slovenia, the above-mentioned reasons most often influenced the selection of certain modes of “everyday” transport as well. The most common reasons for the selection were comfort (61%) and shorter travel time (38%). Environmental reasons were indicated by 7% of interviewees, almost doubling the European average (4%). According to interviewees, environmental reasons for selecting certain modes of transport were even more important than traffic safety and the fact that they lack an alternative to a selected transport mode. In this respect, the Slovenian public showed slightly higher environmental awareness than the average European public.
Environmental engagement, which is primarily reflected in the selection of sustainable mobility modes, is connected, among other things, with the use of public passenger transport. According to the public opinion survey, most interviewees who currently use passenger cars or motorcycles for their daily needs would use public transport if the system provided better geographic coverage (40% of interviewees) and if the services related to public passenger transport were more accessible to users (26% of interviewees). Similar reasons prevailed among the European public (more frequent services – 27% and better geographic coverage - 26%). It needs to be pointed out, however, that 21% of the European and 15% of the Slovenian public would not use public passenger transport as an alternative to the conventional modes of transport should the situation improve in terms of public transport availability and the quality of services. Therefore, the situation is not favourable with respect to promoting the use of public passenger transport.
An attitude towards the use of public transport can partially reflect the quality of such transport. According to European interviewees who expressed their view and were familiar with the situation, public transport has improved slightly over the last five years (services, infrastructure, etc.). Road transport has improved according to 32%, air transport 28% and rail transport according to 28% of European interviewees. On the other hand, 25% of European and 28% of Slovenian interviewees declared that road transport has deteriorated slightly, while they all think the quality of maritime transport has remained the same.
According to survey results, the majority of the European public thinks that the main problems related to road transport are high traffic density resulting in traffic jams (60% of interviewees) and inadequate maintenance of road infrastructure (59% of interviewees). According to the Slovenian public, the main problems are poor maintenance of road infrastructure (80%), followed by road traffic jams (60%). According to 46% of European interviewees, the main problem related to rail transport is high ticket prices, while 44% of Slovenian interviewees see poor maintenance of railway infrastructure as the key issue. Recognition of the environmental and health effects of transport among the interviewees is poor, as they only point out the problem of air pollution. It needs to be emphasised that awareness about environmental problems related to transport does not automatically lead to a change in mobility habits. Only by providing timely, accurate information and raising of awareness can we contribute to changing habit patterns in the field of sustainable mobility.
Among the measures to promote sustainable mobility and encourage travel habits, there is increasing support to the improvement of public transport and infrastructure for pedestrians and cyclists, while pricing policy measures have also been introduced (particularly in relation to more expensive fuels) (EEA, 2004).
In Slovenia, like in most other European countries, activities during European mobility week are directed towards the reduced use of motorised transport and the promotion of walking and cycling, including the construction of proper infrastructure.


