[KM10] Land use change and agriculture

Key message

The indicator presents changes in land use in a short five-year period between 1995 and 2000. Natural conditions, socio-economic factors and administrative measures are reflected in spatial development - land use. Urbanisation of land is increasing and so is the irreversible destruction of natural resources.
Definition
Changes in land use reflect the changes in socio-economic conditions in Slovenia in the period between 1995 and 2000. Industrialisation and changes in traffic infrastructure and city-planning are reflected in increasingly larger areas dedicated to these activities.
Soil (land) is a natural resource enabling the functioning of terrestrial ecosystems. In the past, soil has been assessed prevailingly according to its role in the production of food and biomass. In addition to these roles, which are of primal importance in agriculture and forestry, soil performs its elementary environmental functions on land (for example, filtration of water and charging of underground water, degradation/neutralisation of harmful emissions from traffic and industry; CO2 sequestration, circulation of nutrients and other substances as well as energy). The importance of soil and its environmental role are emphasised in the EU documents (EU Soil Thematic Strategy, 2002) which simultaneously call upon the protection of agricultural land. In comparison with other areas, for example ruderal land, agricultural land is most capable of performing the above-mentioned tasks important for man and environment due to its manifold qualities.
In terms of agri-environmental issues, the most severe problem is accelerated urbanisation of agricultural land. This is the most negative (destructive) process for the soil as a natural resource because of its extensive and irreversible effect – permanent destruction of land.
Afforestation, i.e. transformation of agricultural land into woodland, does not permanently degrade soil as part of the environment, since this is a reversible process. From a narrow, mostly non-agricultural point of view, this change can be considered as a positive indicator. In a comprehensive view of land use changes and their shares in Slovenia, however, afforestation can be assessed as a negative spatial development. According to the latest data of the common European methodology Corine Land Cover (CLC) from 2000, forest covers more than 58 % of Slovenian territory, which ranks Slovenia among the most wooded European countries. In this view, further accelerated afforestation of mostly agricultural land is a negative process ruining the cultural landscape and impoverishing otherwise variegated habitats formed in areas where agricultural and forest use alternate.
In the scope of natural conditions in Slovenia, the variegated intertwinement of wooded and agricultural land, possible due to complex cultivation patterns, can be considered as quality landscape. From an economic aspect, land fragmentation in agricultural production is not desirable, but from the aspect of cultural landscape, variegation of landscape patterns and intertwinement of different types of land use in a sustainable landscape provides greater biodiversity; furthermore, it represents the natural and cultural heritage and identity. The share of land designated in CLC as »agricultural land of complex cultivation patterns« and »predominantly agricultural land with large areas of natural vegetation” occupies 13.7 % and 9 % of the land, respectively. These two areas combined occupy almost a quarter of the entire territory of Slovenia. This variegation is a characteristic Slovenian feature and thus the preservation of such land use can be regarded as a positive indicator of spatial development.
Charts
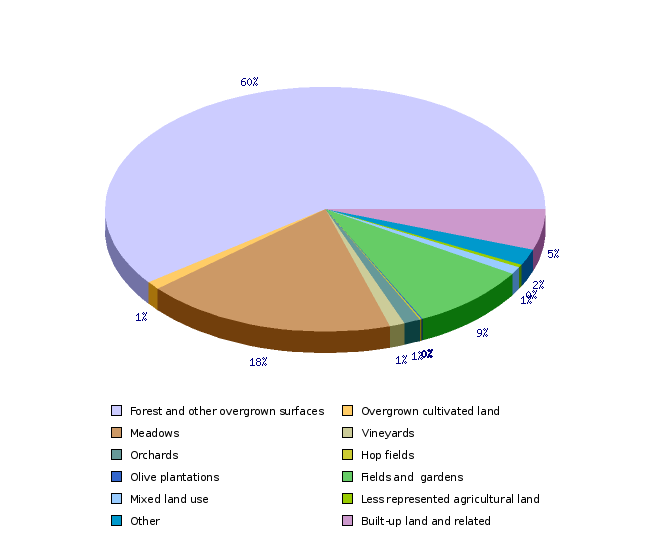
Land use database, Ministry of Agriculture, Forestry and Food 2002, 2005 and 2007; calculations: Agricultural Institute of Slovenia
| Forest and other overgrown surfaces | Overgrown cultivated land | Meadows | Vineyards | Orchards | Hop fields | Olive plantations | Fields and gardens | Mixed land use | Less represented agricultural land | ||
|---|---|---|---|---|---|---|---|---|---|---|---|
| 2002 | ha | 1201686 | 25243 | 350679 | 25295 | 24869 | 2501 | 1139 | 213977 | 18944 | 630 |
| 2005 | ha | 1213173.74 | 19259.65 | 353923.665 | 23484.975 | 27058.945 | 2446.4775 | 1488.0575 | 196190.99 | 19306.9875 | 4847.1725 |
| 2007 | ha | 1219823 | 21983 | 374946 | 22164 | 25028 | 2094 | 1613 | 180941 | 18732 | 8372 |
| Other | Built-up land and related | ||||||||||
| 2002 | ha | 54098 | 108205 | ||||||||
| 2005 | ha | 51724.8625 | 114062.0775 | ||||||||
| 2007 | ha | 42867 | 108732 |
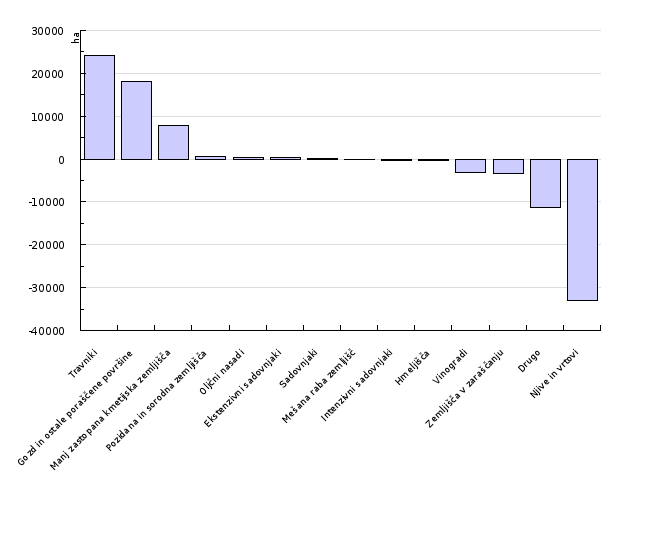
Land use database, Ministry of Agriculture, Forestry and Food 2002, 2005 and 2007; calculations: Agricultural Institute of Slovenia
| Travniki | Gozd in ostale poraščene površine | Manj zastopana kmetijska zemljišča | Pozidana in sorodna zemljišča | Oljčni nasadi | Ekstenzivni sadovnjaki | Sadovnjaki | Mešana raba zemljišč | Intenzivni sadovnjaki | Hmeljišča | ||
|---|---|---|---|---|---|---|---|---|---|---|---|
| 2002-2007 | ha | 24267 | 18137 | 7742 | 527 | 474 | 444 | 159 | -212 | -285 | -407 |
| Vinogradi | Zemljišča v zaraščanju | Drugo | Njive in vrtovi | ||||||||
| 2002-2007 | ha | -3131 | -3260 | -11231 | -33036 |
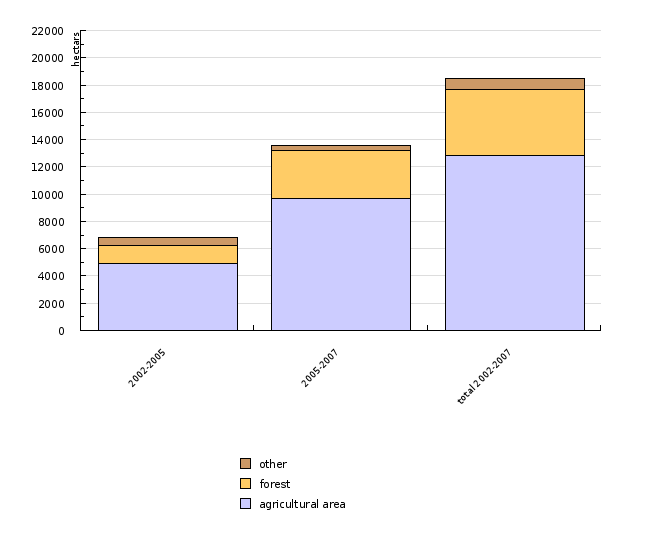
Land use database, Ministry of Agriculture, Forestry and Food 2002, 2005 and 2007; calculations: Agricultural Institute of Slovenia
| 2002-2005 | 2005-2007 | total 2002-2007 | ||
|---|---|---|---|---|
| agricultural area | hectars | 4920 | 9682 | 12852 |
| forest | hectars | 1306 | 3508 | 4810 |
| other | hectars | 618 | 342 | 790 |
| total | hectars | 6843 | 13533 | 18452 |
Quality of soil on urbanized land, Agricultural Institute of Slovenia, Centre for Soil and Environment, 2008
| urbanized areas | Slovenia | ||
|---|---|---|---|
| Better quality soil (TS > 54) | % | 42.9 | 28.9 |
| Middle quality soil (TS 29 - 53) | % | 35.9 | 50.3 |
| Worse quality soil (TS | % | 21.2 | 20.8 |
Goals
As an indicator, land use describes the state of the landscape and management with soil as a natural resource. Soil is the result of natural conditions, historic conditions, socio-economic development, and spatial planning as a set of administrative procedures. The goal of spatial planning is to maintain and shape the cultural landscape while simultaneously ensuring sustainable management of natural resources (soil, waters and mineral raw products) and enabling sustainable economic development.
Comment
Extent of land use changes
At this point, it is only possible to estimate the changes in land use in Slovenia by comparing two geo-coded databases prepared in accordance with the common European methodology. A comparison of this methodology from 1995 (CLC95) and 2000 (CLC00) enables only a rough estimate, but still outlines the direction of the land use processes. Total changes in land use are evident in the appendix -Table 5. It presents the type of land use in two periods and includes data indicating single/rare events (burnt areas) in a larger extent and permanent changes in a smaller extent. In addition to the burnt areas and clearings, the greatest share of changes is seen on construction sites and in the increasing areas of the road and railway network.
The changes are very notable because these are large encroachments in the construction of motorways that we were able to detect in accordance with the CLC criteria. Areas of transitional woodland shrub or areas under afforestation are also evident – burnt areas from 1995, and afforestation of agricultural land. In the CLC data, changes related to the grubbing of agricultural land are not evident, since these are smaller and dispersed areas not detected by the CLC methodology at a scale of 1:100,000. Changes in the shares of burnt areas and water bodies are exceptional events, and there is no use considering these data in the development assessments.
Structural changes in land use
A review of structural changes – changes by individual types of land use - better reflects the development orientation than the changes in total areas do. Changes in land use in 1995 relative to 2000 are presented by individual types of land use in Tables 1-4. We believe that land changes which appear modest at first sight are a good indication of the direction in the last few years.
Direction of changes in land use
Land use is changing in the following manner:
Uneconomical utilisation and degradation of the natural resource due to intensive construction in view of the environmental role of high-capability areas. Building up areas of the highest-quality agricultural land, especially on the bottoms of valleys and along the main traffic corridors, and expanding urban land for the purposes of trade, industry and housing has the most negative impact.
Outside agriculture and forestry, the role of soil is barely known and under-appreciated in sustainable spatial planning. Some claims justify the urbanisation of land with “poor prospects” of Slovenian agriculture.
Methodology
Data are available in two databases prepared with the same methodology in a five-year interval:
• CORINE Land Cover 1995/1996 (CLC95)
• CORINE Land Cover 2000 (CLC00)
Environmental Agency of the Republic of Slovenia is the trustee of the data.
CLC95 and CLC00 are vector digital maps of a polygonal shape. Each polygon (enclosed area) symbolises uniform land use with a designated code by the CORINE Land Cover three-level code system. The scale of input data is 1 : 100.000. Both maps are designed on the basis of the interpretation of geo-coded Landsat TM satellite images with cell resolution of 30 m. In addition to Landsat images, the interpreters used other maps and statistical data, and compared and coordinated them with field surveys and checks. The quality of interpretation was ensured by means of field work. Originally, the smallest area allowed by the Corine Land Cover methodology was 25 ha, though for Slovenia, the smallest polygon size was about 18 ha. Considering the scale, both databases are of good quality and verified, and are fully comparable with other Corine Land Cover data in Europe due to the uniform methodology.
Structural changes in land use were established by comparing them at individual locations. We rasterised the CLC95 and CLC00 vector maps into cells with 10-m sides and 100 m2 surface and analysed the changes in corresponding cells.
A comparison of at least two maps at a larger scale (for example (1 : 5,000) designed using a uniform methodology in a five- to ten-year period would provide a more detailed and adequate description of changes in land use and would better outline the problem of the urbanisation of agricultural land. At this point, we only have one such database at our disposal (MKGP), but it only facilitates the ascertainment of the actual state.


