KAZALCI OKOLJA

Environmental indicators in Slovenia


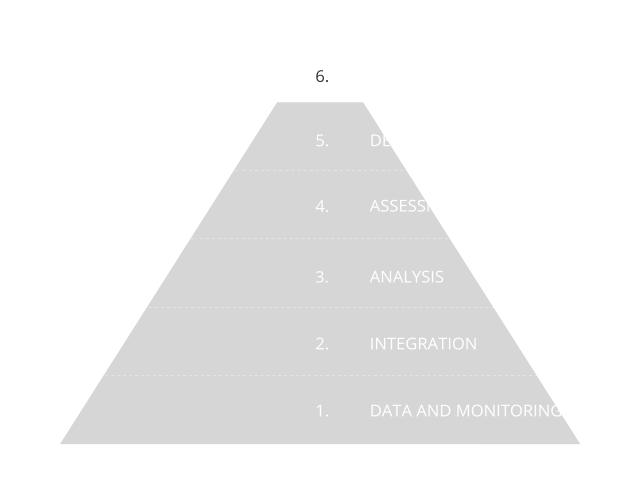
Environmental indicators are based on graphs, maps and assessments and as such present environmental trends in Slovenia. The indicators represent one of the four pillars of our environmental reporting, and are prepared in accordance with the Environmental Protection Act. The Environmental Indicators in Slovenia website enables users to browse among 180 indicators. They are based on numerical data and they indicate the state, characteristics and trends of environmental development in Slovenia. They are prepared using a systematic approach based on data and monitoring, as shown in the information pyramid.

Did you know?

Neutral

The limit value for environmental noise for playgrounds (55dB(A)) determined by the WHO was exceeded at the most exposed facade at 12 primary schools. However none of 34 kindergartens and 22 primary schools was exposed to excess noise limit at all four facades. There were 4,097 pupils in 12 schools and 2,909 children in 24 kindergartens where the high noise levels at most exposed facades were determined in the school year 2013/2014.

Bad

The share of renewable sources in total energy consumption was 18.4% in 2024. It remained unchanged compared to the previous year. The growth of RES is very slow and insufficient to achieve the targets in this area.

Bad

Slovenia’s import dependence has been lower in recent years, amounting to 48% in 2023. Further increases in energy efficiency, the use of renewable sources, and the diversification of supply sources are essential. Slovenia is completely import-dependent for liquid fuels and natural gas. With regard to natural gas, Slovenia is import-dependent on two countries, Austria and Algeria. In the past, gas reaching Austria mostly came from Russia, but in recent years the supply structure has become more diversified due to the war and sanctions.


Neutral

Total greenhouse gas emissions are projected to remain at similar levels as today until 2030 under projection with existing measures, then decline. Under projection with additional measures emissions will decline faster. By 35% by 2030 and by 88% by 2050. Projections show that with intensive implementation of measures, it is possible to achieve the set targets.

Bad

F-gas emissions from leaks from stationary installations increased again in 2024 due to a significantly higher use of refilled refrigerants. This represented a significant deviation from the indicative target for reducing emissions from the use of F-gases under the EU F-gases Regulation. Compared to 2015, F-gas emissions from leaks were 8% lower in 2024, while, according to the F-gases Regulation, they should have been lower by 69%.

Bad

In 2024, the amount of incentives for the implementation of measures related to energy efficiency (EE) and renewable energy sources (RES) in non-ETS industry amounted to EUR 1.1 million, i.e. 18 % less than the previous year. Only Eco Fund incentives are considered in this amount, as the projects co-financed under the Operational Programme for the Implementation of the European Cohesion Policy in the 2014–2020 Period (OP ECP) were not prepared in such a way that the monitoring of effects related to climate targets would be possible.