KAZALCI OKOLJA

Environmental indicators in Slovenia


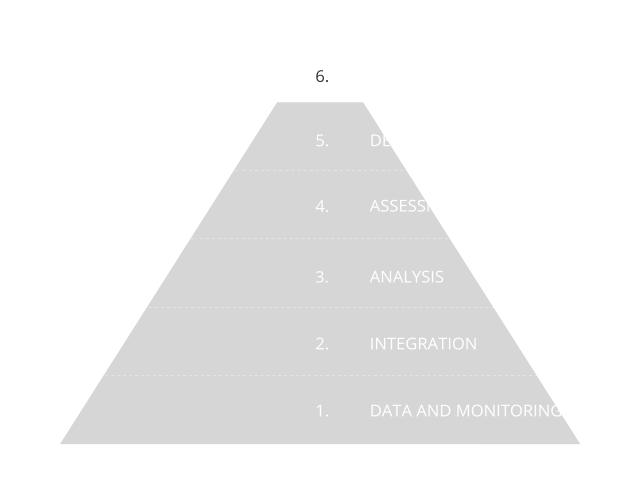
Environmental indicators are based on graphs, maps and assessments and as such present environmental trends in Slovenia. The indicators represent one of the four pillars of our environmental reporting, and are prepared in accordance with the Environmental Protection Act. The Environmental Indicators in Slovenia website enables users to browse among 180 indicators. They are based on numerical data and they indicate the state, characteristics and trends of environmental development in Slovenia. They are prepared using a systematic approach based on data and monitoring, as shown in the information pyramid.

Did you know?

Good

Although electricity and heat generation increased by 30% between 1990 and 2021, CO2 emissions decreased by 31.5%, mainly due to the increase in generation efficiency, as well as to the increase in RES and nuclear generation. SO2 emissions decreased by almost 99%, mainly due to the installation of desulphurisation, the increase in generation efficiency and share of RES and nuclear generation.

Bad

The total annual final energy savings due to the implementation of energy efficiency (EE) and renewable energy source (RES) measures in the residential sector amounted to 1,319 GWh in 2025, and the total annual CO2 emissions reduction was 306 kt. Compared to the previous year, annual energy savings decreased by 39%, while the reduction in CO2 emissions fell by as much as 45%. Lower values were only achieved in the period before 2019.

Neutral

The emission productivity in Slovenia decreased in 2024 and amounted to 3,09 EUR2010/kg CO2 eq. The preliminary estimate for 2025 indicates that emissions productivity has improved, reaching EUR 3.5 EUR2010/kg CO2 eq. The progress in emission productivity in Slovenia when compared to the European Union (EU), is still relatively slow, thus there is a need to further strengthen the connection between economic development and measures for reducing GHG emissions.

Good

Energy efficiency in industry improved significantly between 2005 and 2024, with a 45% increase in 2024 compared to 2005. The chemical industry, machinery and equipment manufacturing, non-ferrous metals, and paper manufacturing contributed the most to the improvement, while steel production and non-metallic mineral products contributed the least.

Bad

F-gas emissions from leaks from stationary installations decreased in 2025 mainly due to lower use of refilled refrigerants. Despite the reduction distance to the indicative target for reducing emissions from the use of F-gases under the EU F-gases Regulation remained large. Compared to 2015, F-gas emissions from leaks were 23% lower in 2025, while, according to the F-gases Regulation, they should have been lower by 76%.

Neutral

Total GHG emissions from the ETS sector increased by 9.3% in 2024 compared with the previous year, following six consecutive years of decline. The increase was driven by higher emissions across all groups, particularly in electricity and heat production and in manufacturing industries. Despite the increase, emissions remained among the lowest levels recorded over the observed period. At the EU level, a legally binding target has been adopted to reduce GHG emissions from the ETS sector by 62% by 2030 compared with 2005 levels.