KAZALCI OKOLJA

Environmental indicators in Slovenia


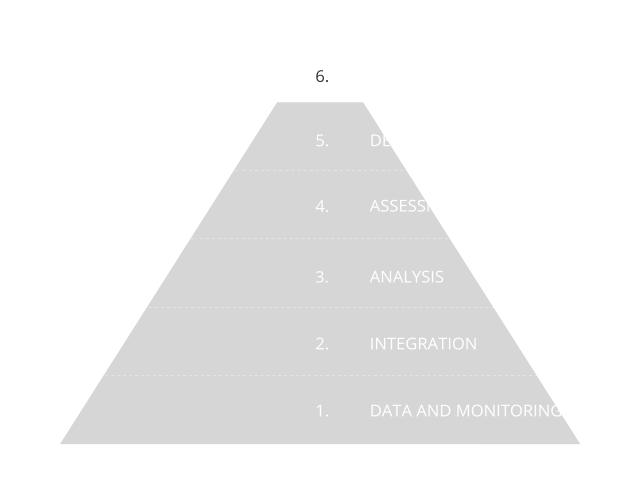
Environmental indicators are based on graphs, maps and assessments and as such present environmental trends in Slovenia. The indicators represent one of the four pillars of our environmental reporting, and are prepared in accordance with the Environmental Protection Act. The Environmental Indicators in Slovenia website enables users to browse among 180 indicators. They are based on numerical data and they indicate the state, characteristics and trends of environmental development in Slovenia. They are prepared using a systematic approach based on data and monitoring, as shown in the information pyramid.

Did you know?

Good

Although electricity and heat generation increased by 30% between 1990 and 2021, CO2 emissions decreased by 31.5%, mainly due to the increase in generation efficiency, as well as to the increase in RES and nuclear generation. SO2 emissions decreased by almost 99%, mainly due to the installation of desulphurisation, the increase in generation efficiency and share of RES and nuclear generation.

Bad

The intensity of GHG emissions from fuels and energy in transport in Slovenia was 4.7% lower than the baseline in 2021, which is 1.3 percentage points below the target reduction. Although the intensity is decreasing, the pace is too slow. The largest contribution to reducing intensity comes from the blending of biofuels. In the EU, the largest reductions were achieved by Sweden and Finland, along with 11 other countries that achieved reductions of 6% or more.

Good

The share of electricity from renewable energy sources in gross electricity consumption reached 50.7% in 2024, representing a noticeable increase compared to the previous year. This growth was driven by favourable hydrological conditions and continued expansion of solar power generation, while gross electricity consumption decreased by 3.6%. Hydropower remains the key source of renewable electricity, accounting for 78% of all renewable electricity produced in 2024.

Good

In 2024, the energy reduction in the energy efficiency obligation scheme (EEOS) and alternative measure, t. i. Eco Fund programs, amounted to 671 GWh. The savings were more than a half lower than the previous year, mainly due to the fact that the EEOS obligated parties covered their obligations to a large extent with surpluses of savings from previous years. The target value for 2024 was nevertheless exceeded by 38% – because of the transfer of the part of the surplus savings from 2023 within the EEOS the energy savings amounted to 1,028 GWh.

Neutral

The level of household consumption, as well as savings or investments, largely depends on disposable income. It is a fundamental indicator of household material well-being. Household consumption in Slovenia fell significantly during the pandemic in 2020, while disposable income maintained positive growth. A few years later, in 2024, household consumption recorded a 1.6% growth. In the same year, disposable income per capita grew in all statistical regions; the highest in the Osrednjeslovenska region and the lowest in the Pomurska region.

Neutral

One of the main reasons of mortality due to respiratory diseases is in Slovenia chronic pulmonary disease (COPD). The highest mortality rate due to respiratory diseases in Slovenia is in Podravska and Pomurska region and the lowest in Central-Slovenian region (2022–2024). Mortality due to respiratory diseases is decreasing; in the period 2017 to 2021 it decreased from 62/100.000 inhabitants to 43/100.000 inhabitants in the year 2024. This can be attributed to the “harvesting effect” of COVID 19.