[OD01] Municipal waste 

Key message

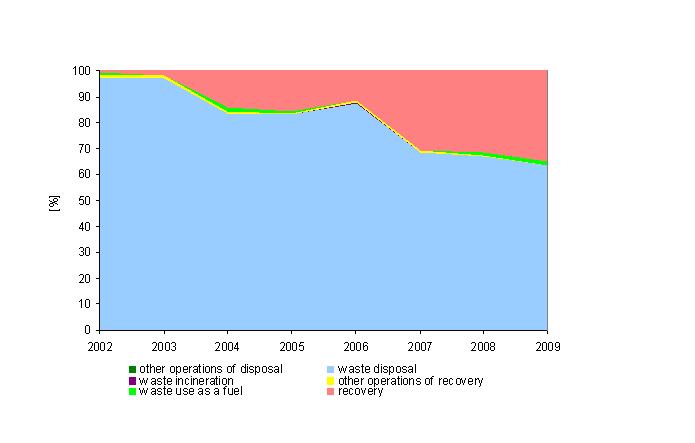
Recycling of municipal waste is increasing in Slovenia. In 2012, almost 40 per cent of municipal waste was recycled. Disposal of waste has declined over the years, 42 per cent of municipal waste was landfilled in 2012. Incineration remains minimal, at slightly above one per cent.
Definition
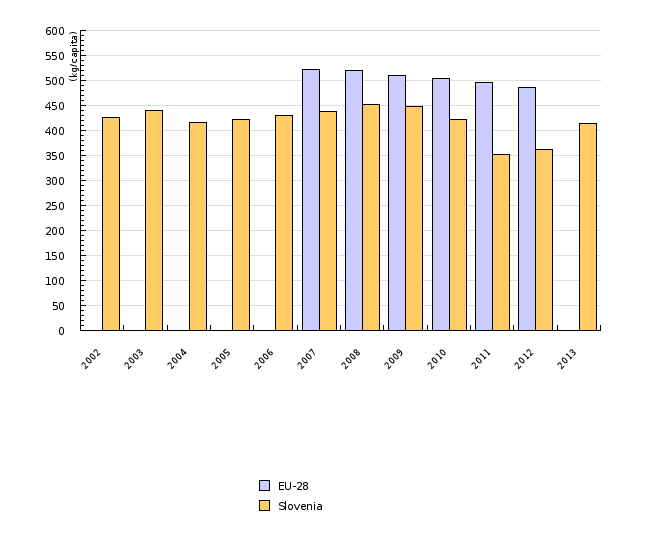
This indicator shows the quantity of municipal waste per capita in Slovenia and other EU countries.
Municipal waste is defined as waste from households and other waste similar to household waste by its nature and composition. According to the Environmental Protection Act (Official Gazette of the Republic of Slovenia, Nos 39/06 and 70/08-ZVO-1B), municipal waste is collected and transported within the obligatory municipal public utility service of environmental protection. Municipal waste treatment is regulated by the Decree on waste (Official Gazette of the Republic of Slovenia, No. 24/12).
Municipal treatment in Slovenia is organised within obligatory municipal public utility services for collecting and transporting municipal waste, treatment of mixed municipal waste and landfilling of the remaining waste.
Charts
Statistical office of the RS of Slovenia, SI-STAT data portal, Environmental indicators, 2014.
| 2002 | 2003 | 2004 | 2005 | 2006 | 2007 | 2008 | 2009 | 2010 | 2011 | ||
|---|---|---|---|---|---|---|---|---|---|---|---|
| waste generated - non-hazardous and hazardous | t | 850740 | 879829 | 832827 | 844949 | 865620 | 885595 | 922829 | 912981 | 863877 | 721844 |
| waste generated - hazardous | t | 863 | 1145 | 906 | 1000 | 1461 | 2907 | 3024 | 3577 | 3484 | 4069 |
| 2012 | 2013 | ||||||||||
| waste generated - non-hazardous and hazardous | t | 744010 | 853388 | ||||||||
| waste generated - hazardous | t | 5035 | 5156 |
Statistical Office of the Republic of Slovenia, 2014; EUROSTAT, Municipal waste generated, 2014
| 2002 | 2003 | 2004 | 2005 | 2006 | 2007 | 2008 | 2009 | 2010 | 2011 | ||
|---|---|---|---|---|---|---|---|---|---|---|---|
| EU-28 | kg per capita | 523 | 521 | 511 | 504 | 496 | |||||
| Slovenia | kg per capita | 426 | 441 | 417 | 422 | 431 | 439 | 453 | 449 | 422 | 352 |
| 2012 | 2013 | ||||||||||
| EU-28 | kg per capita | 487 | |||||||||
| Slovenia | kg per capita | 362 | 414 |
Eurostat, 2014
| 2002 | 2003 | 2004 | 2005 | 2006 | 2007 | 2008 | 2009 | 2010 | 2011 | ||
|---|---|---|---|---|---|---|---|---|---|---|---|
| waste disposal | % | 87.7 | 83.3 | 64.5 | 66.6 | 70 | 65 | 62.5 | 58.8 | 55.5 | 49.2 |
| waste incineration | % | 0.5 | 0.7 | 1.6 | 0.2 | 0 | 0 | 1.3 | 1.3 | 1 | 1.4 |
| recycling | % | 9 | 12.6 | 20.4 | 18.6 | 15.4 | 21.9 | 18.9 | 19.6 | 22.1 | 33.8 |
| other operations of recovery and disposal | % | 2.8 | 3.4 | 13.4 | 14.6 | 14.6 | 13.1 | 17.3 | 20.3 | 21.4 | 15.6 |
| 2012 | |||||||||||
| waste disposal | % | 42.3 | |||||||||
| waste incineration | % | 1.4 | |||||||||
| recycling | % | 39.5 | |||||||||
| other operations of recovery and disposal | % | 16.9 |
Environment in the palm of your hand, 2007
Goals
- Separate collection of waste at source and effective treatment (mechanical, biological, thermal) of the waste remaining after separate collection.
- To increase the preparation of waste paper, metals, plastic and glass from households and, to the highest possible extent, from other sources from which waste flows are similar to household waste, for reuse and recycling by at least 50% of the total mass by 2020.
Comment
Along with economic growth and growing purchasing power, larger quantities of waste are being generated in households than ever before. This is reflected in the increased use of natural resources, as only a third of generated waste is being recycled.
In Slovenia, more than 400 kg of municipal waste per capita, per year is generated. In 2013, 853,388 tonnes of municipal waste were generated, which amounted to 414 kg per capita. The quantity of generated waste increased by 17% in the period 2003–2008. In 2009, it decreased slightly for the first time since 2003 and continued to decrease in 2010 and 2011. In 2012, the quantity of generated municipal waste started to grow again.
In recent years, the share of separately collected fractions of municipal waste has been increasing. In 2012, it amounted to almost 40% (the share of collected mixed municipal waste was 60%). Door-to-door collection of separated waste packaging and biodegradable household waste, waste glass and paper as well as hazardous and bulky waste facilitate further treatment of separately collected waste (recycling and processing). In this way, we contribute to the preservation of natural resources and the reduction of negative impacts of landfills on the environment (e.g. CO2 and other landfill gas emissions and leachate, impacts on groundwater).
The recycling of municipal waste has been increasing in recent years. In 2012, almost 40% of municipal waste was recycled. Incineration remains minimal at slightly over one per cent of total collected municipal waste.
Despite the efforts to follow the hierarchy of waste management as closely as possible and dispose of as little waste as possible in landfills, we still dispose of more than 40% of generated municipal waste. Therefore, the strategic document in this field proposes certain measures that would, inter alia, enable the share of recycled municipal waste to increase to 61–64%, the share of incinerated waste to increase to approximately 25% and the share of municipal waste dumped in landfills to decrease to 11–15%, all by 2020. Achieving these goals will require investments in infrastructure estimated at EUR 291 million for the period 2007–2015 (cohesion funds, state and municipal budgets) and EUR 200 million for the period 2016–2020. In addition, greater attention will need to be given to raising public awareness.
Quantities of generated municipal waste vary considerably between the EU Member States, which is largely a consequence of various socio-economic conditions and levels of environmental awareness. In 2012, an average of 487 kg of municipal waste per capita was generated in the EU-28.
Methodology
Data for Slovenia:
Objectives summarized by: Resolution on National Environmental Action Plan 2005-2012 (ReNPVO, Official Gazette of the Republic of Slovenia, No. 2/06)
Source database or source: Analysis of waste management annual reports; Waste Management Database, Environmental Agency of the Republic of Slovenia.
Data administrator: Environmental Agency of the Republic of Slovenia.
Data acquisition date for this indicator: 9 December 2009
Methodology and frequency of data collection for the indicator: Data have been captured for the 1995-2007 period. The Ministry of the Environment and Spatial Planning – Environmental Agency of the Republic of Slovenia has been monitoring the generation of municipal waste since 2001. In accordance with the Order on the management of separately collected fractions in the public service of urban waste management (Official Gazette of the Republic of Slovenia, No. 21/01) the providers of public municipal waste collection service report on collected quantities to the Environmental Agency of the Republic of Slovenia once a year (on 31 March) using a special report form. The content of each submitted and completed form is checked. If it contains irregularities, the data are reconciled with the contractor. The reports acquired are entered into the database. The data on the collected quantities are used to estimate the quantity of generated municipal waste.
The quantities of generated municipal waste have also been monitored by the Statistical Office of the Republic of Slovenia and are published in the SI-STAT web database.
Until 2007, data on hazardous municipal waste were captured together with municipal waste; after 2007, however, hazardous municipal waste has been recorded separately, so that the quantities of municipal waste for the years 2007 and 2008, as compared to the preceding years, only contain the collected quantities of non-hazardous municipal waste.
In 2008, the methodology of gathering and processing of data on collected quantities of waste was harmonised, so that the data of the Environmental Agency of the Republic of Slovenia and of the Statistical Office of the Republic of Slovenia are now coordinated and will no longer be reported separately.
The size of population for indicator calculation has been taken from the Statistical Yearbook (December data for the current year). Data for EU-27 (Municipal waste generated) have been taken from the Eurostat web database of December 2009.
Data processing methodology: The graph in Figure OD1-1 presents data on the collected quantity of municipal waste in Slovenia gathered by the Environmental Agency of the Republic of Slovenia and by the Statistical Office of the Republic of Slovenia. Quantities of municipal waste have been converted to data per capita, taking into account the size of population as at 31 December of the current year.
Data on collected quantity of municipal waste in the EU-27 were taken from Eurostat database (Municipal waste generated) with already calculated quantities of municipal waste per capita.
Figure OD1-2, however, shows the shares of recovery and disposal of municipal waste in Slovenia in the 2002-2008 period.
Information concerning data quality:
- Advantages and disadvantages of the indicator: the methodologies for gathering data on municipal waste of the Environmental Agency of the Republic of Slovenia and of the Statistical Office of the Republic of Slovenia were somewhat different in the past years, and therefore these data are not directly comparable and show deviations.
- Relevance, accuracy, robustness, uncertainty:
Reliability of the indicator (archival data):/
Uncertainty of the indicator (scenarios/projections):/
- Overall assessment (1 = no major comments, 3 = data to be considered with reservation);
Relevance: 1
Accuracy: 1
Completeness over time: 2
Completeness over space: 1
Other sources and literature:
- ENVIRONMENT IN THE PALM OF YOUR HAND: Slovenia. 2007. Ljubljana, The Ministry of the Environment and Spatial Planning, Environmental Agency of the Republic of Slovenia, 112 pages.
- EUROSTAT, 2009. Municipal waste generated.(cited as at 9 December 2009).


