[EN25] Energy import dependency
[EN25] Energy import dependency

Key message

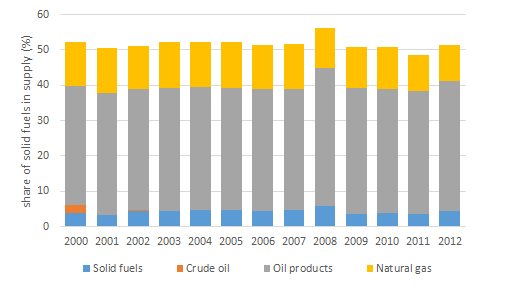
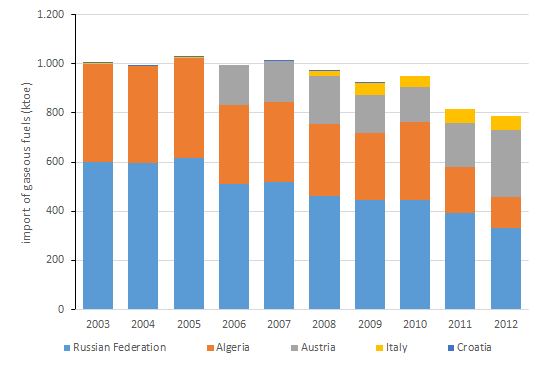
The energy import dependency of Slovenia was reduced in the period 2009–2011, but it increased by 2 percentage points in 2012. The most problematic of this dependency is the import of gaseous fuels, as Slovenia is heavily dependent on imports from Russia and Algeria.
Charts
Figure EN25-1: Share of imported fossil fuels in total energy supply in Slovenia
Sources:
Statistical Office of the RS, 2013; Jožef Stefan Institute, 2013
| 2000 | 2001 | 2002 | 2003 | 2004 | 2005 | 2006 | 2007 | 2008 | 2009 | ||
|---|---|---|---|---|---|---|---|---|---|---|---|
| Solid fuels | % | 3.74 | 3.14 | 4.55 | 4.46 | 4.73 | 4.56 | 4.53 | 4.56 | 5.74 | 3.64 |
| Crude oil | % | 2.46 | 0.07 | 0.07 | -0.01 | -0.01 | -0.01 | -0.01 | -0.01 | -0 | -0 |
| Oil products | % | 33.47 | 34.72 | 34.39 | 34.68 | 34.74 | 34.79 | 34.5 | 34.48 | 39.15 | 35.48 |
| Natural gas | % | 12.63 | 12.68 | 12.11 | 13.23 | 12.72 | 12.84 | 12.4 | 12.6 | 11.45 | 11.82 |
| Import dependency in gross inland consumption | % | 52.3 | 50.61 | 51.11 | 52.36 | 52.18 | 52.19 | 51.42 | 51.64 | 56.34 | 50.93 |
| 2010 | 2011 | 2012 | |||||||||
| Solid fuels | % | 3.93 | 3.56 | 4.29 | |||||||
| Crude oil | % | -0.01 | -0.01 | -0 | |||||||
| Oil products | % | 34.98 | 34.8 | 36.92 | |||||||
| Natural gas | % | 12.03 | 10.17 | 10.13 | |||||||
| Import dependency in gross inland consumption | % | 50.93 | 48.53 | 51.33 |
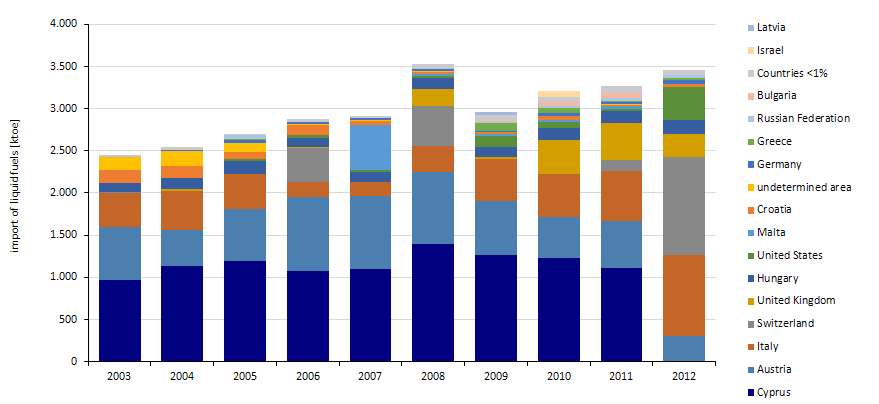
Figure EN25-2: Import of liquid fuels by countries in period 2003-2012
Sources:
Statistical Office of the RS, 2013; Jožef Stefan Institute, 2013
| 2003 | 2004 | 2005 | 2006 | 2007 | 2008 | 2009 | 2010 | 2011 | 2012 | ||
|---|---|---|---|---|---|---|---|---|---|---|---|
| Cyprus | ktoe | 963.83 | 1134.28 | 1193.51 | 1073.54 | 1093.08 | 1398.53 | 1267.67 | 1226.37 | 1115.04 | 0 |
| Austria | ktoe | 629.62 | 429.59 | 618.76 | 879.13 | 867.58 | 855.89 | 635.47 | 491.89 | 550.21 | 300.08 |
| Italy | ktoe | 409.36 | 456.1 | 415.39 | 174.94 | 171.46 | 303.48 | 499.36 | 505.53 | 592.36 | 964.41 |
| Switzerland | ktoe | 13.76 | 0 | 0 | 410.61 | 2.2 | 474.19 | 1.1 | 0 | 135.33 | 1156.88 |
| United Kingdom | ktoe | 0 | 26.45 | 0 | 4.07 | 0 | 203.67 | 27.47 | 410.05 | 431.47 | 274.74 |
| Hungary | ktoe | 106.26 | 133.8 | 147.47 | 115.54 | 112.32 | 126.71 | 119.52 | 133.89 | 143.62 | 174.17 |
| United States | ktoe | 0 | 0 | 27.52 | 35.16 | 23.69 | 26.75 | 122.16 | 72.75 | 30.47 | 392.22 |
| Malta | ktoe | 0 | 0 | 0 | 0 | 541.57 | 27.47 | 30.52 | 30.52 | 33.58 | 0 |
| Croatia | ktoe | 152.46 | 137.98 | 80.34 | 113.56 | 40.1 | 17.82 | 17.66 | 38.07 | 14.35 | 30.17 |
| undetermined area | ktoe | 153.31 | 178.86 | 113.36 | 8.34 | 13.36 | 15.31 | 3.97 | 7.29 | 4.15 | 1.02 |
| Germany | ktoe | 0 | 13.31 | 27.32 | 28.66 | 19.87 | 26.27 | 11.62 | 30.16 | 32.26 | 41.05 |
| Greece | ktoe | 0 | 0 | 12.21 | 0 | 0 | 0 | 90.56 | 67.15 | 13.23 | 30.52 |
| Russian Federation | ktoe | 5.17 | 0 | 48.84 | 2.2 | 8.8 | 5.5 | 12.1 | 20.9 | 33.52 | 30.8 |
| Bulgaria | ktoe | 0 | 0 | 0 | 0 | 0 | 0 | 17.8 | 39.68 | 54.73 | 0 |
| Countries | ktoe | 12.1 | 33.55 | 15.58 | 31.59 | 17.11 | 42.74 | 71.88 | 60.65 | 89.32 | 61.36 |
| Israel | ktoe | 0 | 0 | 0 | 0 | 0 | 0 | 1.04 | 72.31 | 0 | 0 |
| Latvia | ktoe | 0 | 0 | 0 | 0 | 0 | 0 | 33.58 | 0 | 0 | 0 |
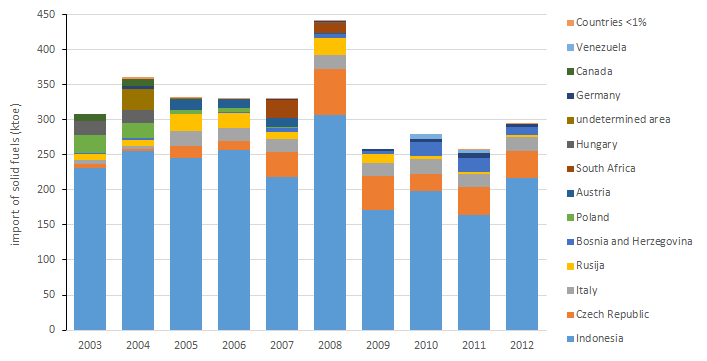
Figure EN25-3: Import of solid fuels by countries in period 2003-2012
Sources:
Statistical Office of the RS, 2013; Jožef Stefan Institute, 2013
| 2002 | 2004 | 2005 | 2006 | 2007 | 2008 | 2009 | 2010 | 2011 | 2012 | ||
|---|---|---|---|---|---|---|---|---|---|---|---|
| Indonesia | ktoe | 230.65 | 255.23 | 245.07 | 256.49 | 218.14 | 306.26 | 171.39 | 198.02 | 164.41 | 217.08 |
| Czech Republic | ktoe | 6.26 | 2.96 | 18.23 | 12.8 | 35.73 | 66.89 | 49.01 | 24.02 | 39.64 | 38.69 |
| Italy | ktoe | 5.64 | 4.94 | 20.82 | 19.68 | 18.34 | 19.84 | 17.65 | 21.47 | 18.43 | 19.22 |
| Russian Federation | ktoe | 8.36 | 8.55 | 23.51 | 21.19 | 10.92 | 24.26 | 13.13 | 4.23 | 3.03 | 3.64 |
| Bosnia and Herzegovina | ktoe | 1.16 | 2.86 | 0 | 0.71 | 4.55 | 5.03 | 3.6 | 20.43 | 20.2 | 10.62 |
| Poland | ktoe | 26.36 | 21.06 | 6.44 | 5.61 | 1.82 | 0 | 0 | 0 | 0 | 0 |
| Austria | ktoe | 0 | 0 | 15.63 | 12.72 | 13.29 | 1.41 | 0.7 | 0 | 0 | 0 |
| South Africa | ktoe | 0 | 0 | 0 | 0 | 26.08 | 14.56 | 0 | 0 | 0 | 0 |
| Hungary | ktoe | 20.44 | 19.04 | 0 | 0 | 0 | 0.7 | 0 | 0 | 0 | 0 |
| undetermined area | ktoe | 0 | 29.56 | 0.98 | 0 | 0 | 0 | 0 | 0.36 | 0 | 0 |
| Germany | ktoe | 0 | 3.53 | 0.59 | 0.62 | 1.31 | 2.52 | 2.55 | 4.73 | 6.24 | 4.71 |
| Canada | ktoe | 9.87 | 10.58 | 0 | 0 | 0 | 0 | 0 | 0 | 0 | 0 |
| Venezuela | ktoe | 0 | 0 | 0 | 0 | 0 | 0 | 0 | 6.64 | 5.45 | 0.61 |
| Countries | ktoe | 0 | 2.12 | 1.56 | 0.62 | 1.21 | 0.61 | 0 | 0 | 0.61 | 0.61 |
Figure EN25-4: Import of gaseous fuels by countries in period 2003-2012
Sources:
Statistical Office of the RS, 2013; Jožef Stefan Institute, 2013
| 2002 | 2004 | 2005 | 2006 | 2007 | 2008 | 2009 | 2010 | 2011 | 2012 | ||
|---|---|---|---|---|---|---|---|---|---|---|---|
| Russian Federation | ktoe | 599.93 | 595.01 | 614.93 | 509.63 | 517.27 | 460.71 | 446.79 | 447.45 | 392.47 | 330.54 |
| Algeria | ktoe | 400.59 | 396.96 | 410.55 | 321.49 | 326.31 | 294.81 | 269.97 | 314.18 | 188.07 | 125.94 |
| Austria | ktoe | 0 | 0 | 0 | 164.23 | 166.71 | 195.33 | 158.31 | 142.81 | 179.9 | 275.48 |
| Italy | ktoe | 0.93 | 0.91 | 1.82 | 0 | 1.53 | 21.71 | 45.02 | 47.6 | 57.23 | 55.1 |
| Croatia | ktoe | 1.27 | 0.91 | 0.91 | 0 | 1.07 | 0.91 | 0.98 | 0 | 0 | 0 |
Methodology
Date of data source summarization


