-
-
-
-
-
-
-
-
Tools and collections
- Environmental atlas
- EIONET in Slovenia
- Environmental indicators
- IED devices
- Endangered species
- IS-waste

-
-
Tools and collections
- Environmental atlas
- EIONET in Slovenia
- Environmental indicators
- IED devices
- Endangered species
- IS-waste

[EN28] Energy efficiency and energy consumption in the household sector 

Key message

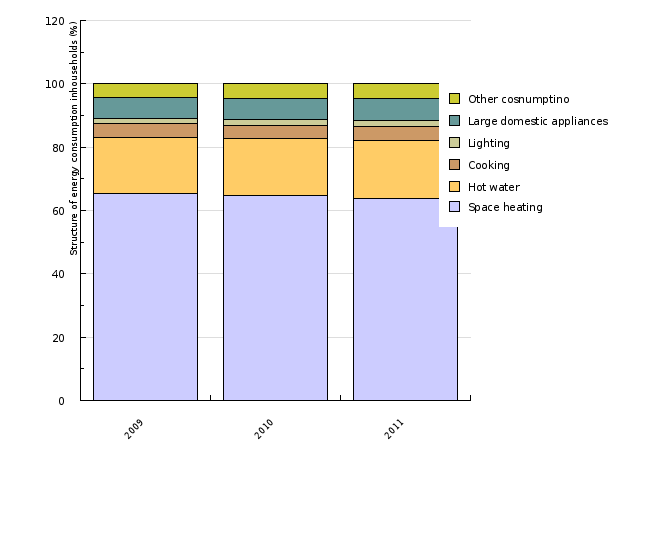
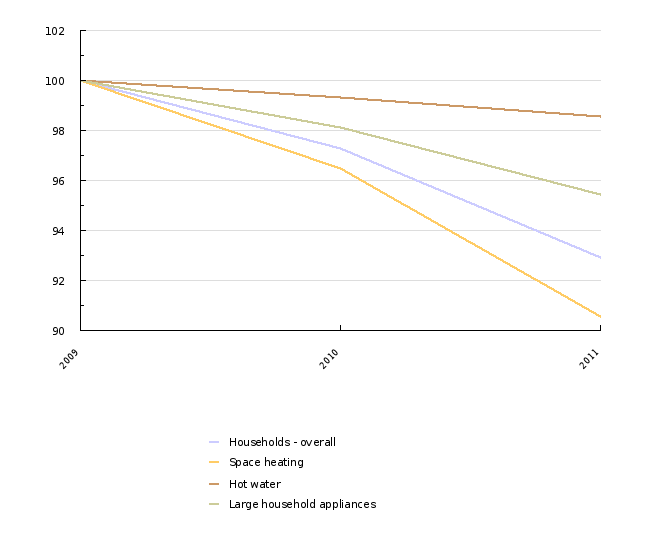
The most of energy in households is used for heating of appartments. In the period 2009-2011, efficiency of energy use increased a lot, especially on the account of increase of efficiency of energy used for heating.
Definition
The indicator shows distribution of energy use in households as regards the aim of use (heating, preparation of hot water, cooking, energy use in household appliances and the rest). Additional indicator shows movement of energy eficiency in households.
Energy efficiency affects energy use. Increase of energy efficiency affects, at the same activity, reduction of energy use. If increase of energy efficiency affects activity increase, the so called rebound effect happens.
Charts
Statistical Office of the RS, 2012; Jožef Stefan Institute, 2012.
| 2009 | 2010 | 2011 | ||
|---|---|---|---|---|
| Space heating | % | 65.4 | 64.7 | 63.7 |
| Hot water | % | 17.8 | 18 | 18.5 |
| Cooking | % | 4.2 | 4.2 | 4.4 |
| Lighting | % | 1.8 | 1.8 | 1.8 |
| Large domestic appliances | % | 6.6 | 6.7 | 6.9 |
| Other cosnumptino | % | 4.2 | 4.5 | 4.6 |
Jožef Stefan Institute, 2012
| 2009 | 2010 | 2011 | ||
|---|---|---|---|---|
| Households - overall | 2009=100 | 100 | 97.3 | 92.9 |
| Space heating | 2009=100 | 100 | 96.5 | 90.5 |
| Hot water | 2009=100 | 100 | 99.3 | 98.6 |
| Large household appliances | 2009=100 | 100 | 98.1 | 95.5 |
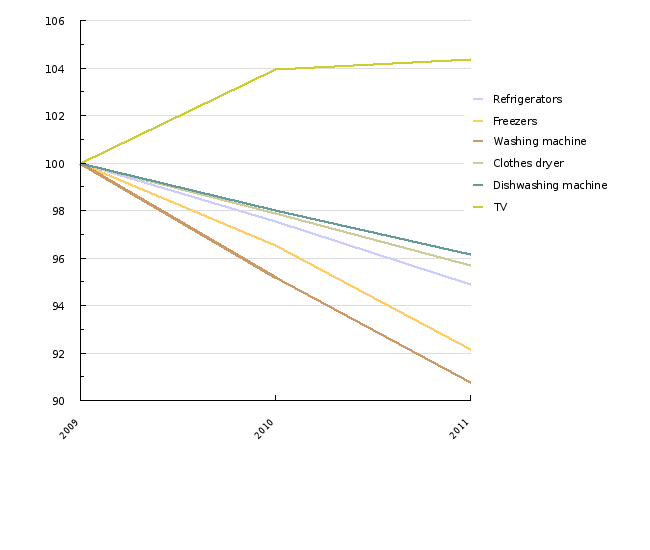
Jožef Stefan Institute, 2012.
| 2009 | 2010 | 2011 | ||
|---|---|---|---|---|
| Refrigerators | 2009=100 | 100 | 97.5 | 94.9 |
| Freezers | 2009=100 | 100 | 96.5 | 92.2 |
| Washing machine | 2009=100 | 100 | 95.2 | 90.8 |
| Clothes dryer | 2009=100 | 100 | 97.9 | 95.7 |
| Dishwashing machine | 2009=100 | 100 | 98 | 96.2 |
| TV | 2009=100 | 100 | 103.9 | 104.4 |
Related indicators
Matjaž Česen, Institut Jožef Stefan


