[OP03] Eco-schools
[OP03] Eco-schools

Definition
Charts
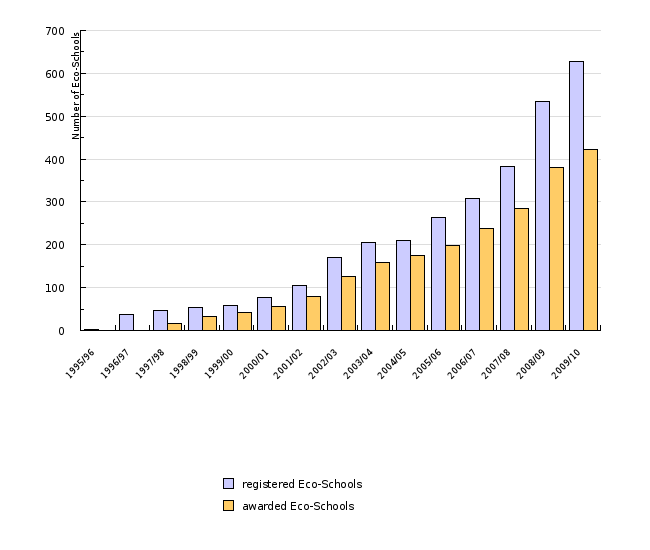
Figure OP03-1: Registered Eco-Schools in Slovenia
Sources:
Doves, 2007
| 1995/96 | 1996/97 | 1997/98 | 1998/99 | 1999/00 | 2000/01 | 2001/02 | 2002/03 | 2003/04 | 2004/05 | ||
|---|---|---|---|---|---|---|---|---|---|---|---|
| registered Eco-Schools | number | 2 | 37 | 47 | 54 | 59 | 78 | 105 | 170 | 206 | 209 |
| awarded Eco-Schools | number | 0 | 0 | 17 | 33 | 43 | 56 | 79 | 127 | 159 | 175 |
| schools total | number | 1830 | 1837 | 1814 | 1826 | 1833 | 1838 | 1817 | 1784 | 1769 | 1753 |
| 2005/06 | 2006/07 | 2007/08 | 2008/09 | 2009/10 | |||||||
| registered Eco-Schools | number | 263 | 307 | 383 | 535 | 628 | |||||
| awarded Eco-Schools | number | 199 | 238 | 284 | 380 | 423 | |||||
| schools total | number | 1774 | 1784 | 1788 | 1820 | 1834 |
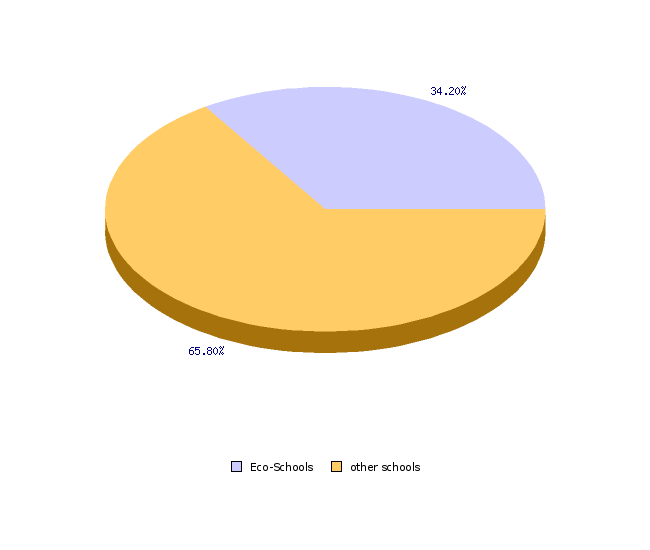
Figure OP03-2: Share of Eco-Schools in the total number of schools in Slovenia for the school year 2005/06
Sources:
Doves, 2007, Statistical Office of the Republic of Slovenia, 2006.
| 2008/09 | ||
|---|---|---|
| Eco-Schools | number | 628 |
| other schools | number | 1206 |
| schools total | number | 1834 |
| Eco-Schools | % | 34.2 |
| other schools | % | 65.8 |
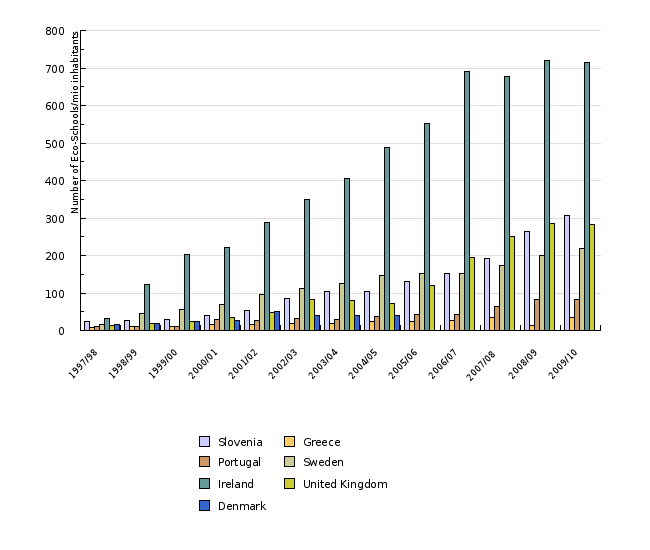
Figure OP03-3: Number of registered Eco-Schools in Slovenia and in the EU countries with the highest number of Eco-Schools
Sources:
Doves, 2007
| 1997/98 | 1998/99 | 1999/00 | 2000/01 | 2001/02 | 2002/03 | 2003/04 | 2004/05 | 2005/06 | 2006/07 | ||
|---|---|---|---|---|---|---|---|---|---|---|---|
| Slovenia | number of Eco-Schools | 47 | 54 | 59 | 78 | 105 | 170 | 206 | 209 | 263 | 307 |
| Greece | number of Eco-Schools | 88 | 116 | 133 | 171 | 175 | 202 | 223 | 250 | 283 | 313 |
| Portugal | number of Eco-Schools | 124 | 116 | 121 | 302 | 292 | 334 | 314 | 398 | 455 | 463 |
| Sweden | number of Eco-Schools | 150 | 406 | 500 | 625 | 865 | 1003 | 1135 | 1330 | 1362 | 1373 |
| Ireland | number of Eco-Schools | 123 | 460 | 766 | 850 | 1120 | 1387 | 1633 | 2005 | 2322 | 2980 |
| United Kingdom | number of Eco-Schools | 833 | 1175 | 1494 | 2012 | 2905 | 4977 | 4747 | 4284 | 7285 | 11891 |
| Denmark | number of Eco-Schools | 82 | 104 | 130 | 150 | 275 | 210 | 210 | 220 | ||
| Slovenia | population | 1984923 | 1978334 | 1987755 | 1990094 | 1994026 | 1995033 | 1996433 | 1997590 | 2003358 | 2010377 |
| Greece | population | 10808358 | 10861402 | 10903757 | 10931206 | 10968708 | 11006377 | 11040650 | 11082751 | 11125179 | 11171740 |
| Portugal | population | 10109697 | 10148883 | 10195014 | 10256658 | 10329340 | 10407465 | 10474685 | 10529255 | 10569592 | 10599095 |
| Sweden | population | 8847625 | 8854322 | 8861426 | 8882792 | 8909128 | 8940788 | 8975670 | 9011392 | 9047752 | 9113257 |
| Ireland | population | 3693386 | 3732006 | 3777565 | 3832783 | 3899702 | 3964191 | 4028851 | 4111672 | 4208156 | 4312526 |
| United Kingdom | population | 58394596 | 58579685 | 58785246 | 58999781 | 59216138 | 59435480 | 59697037 | 60038695 | 60409918 | 60781346 |
| Denmark | population | 5294860 | 5313577 | 5330020 | 5349212 | 5368354 | 5383507 | 5397640 | 5411405 | 5427459 | 5447084 |
| Slovenia | no. Eco-Schools/mio. inhab. | 24 | 27 | 30 | 39 | 53 | 85 | 103 | 105 | 131 | 153 |
| Greece | no. Eco-Schools/mio. inhab. | 8 | 11 | 12 | 16 | 16 | 18 | 20 | 23 | 25 | 28 |
| Portugal | no. Eco-Schools/mio. inhab. | 12 | 11 | 12 | 29 | 28 | 32 | 30 | 38 | 43 | 44 |
| Sweden | no. Eco-Schools/mio. inhab. | 17 | 46 | 56 | 70 | 97 | 112 | 126 | 148 | 151 | 151 |
| Ireland | no. Eco-Schools/mio. inhab. | 33 | 123 | 203 | 222 | 287 | 350 | 405 | 488 | 552 | 691 |
| United Kingdom | no. Eco-Schools/mio. inhab. | 14 | 20 | 25 | 34 | 49 | 84 | 80 | 71 | 121 | 196 |
| Denmark | no. Eco-Schools/mio. inhab. | 15 | 20 | 24 | 28 | 51 | 39 | 39 | 41 | ||
| 2007/08 | 2008/09 | 2009/10 | |||||||||
| Slovenia | number of Eco-Schools | 383 | 535 | 628 | |||||||
| Greece | number of Eco-Schools | 377 | 162 | 402 | |||||||
| Portugal | number of Eco-Schools | 686 | 878 | 878 | |||||||
| Sweden | number of Eco-Schools | 1600 | 1865 | 2055 | |||||||
| Ireland | number of Eco-Schools | 2980 | 3200 | 3200 | |||||||
| United Kingdom | number of Eco-Schools | 15295 | 17633 | 17636 | |||||||
| Denmark | number of Eco-Schools | ||||||||||
| Slovenia | population | 2010269 | 2032362 | 2046976 | |||||||
| Greece | population | 11213785 | 11260402 | 11305118 | |||||||
| Portugal | population | 10617575 | 10627250 | 10637713 | |||||||
| Sweden | population | 9182927 | 9256347 | 9340682 | |||||||
| Ireland | population | 4401335 | 4450030 | 4467854 | |||||||
| United Kingdom | population | 61191951 | 61595091 | 62008048 | |||||||
| Denmark | population | 5475791 | 5511451 | 5534738 | |||||||
| Slovenia | no. Eco-Schools/mio. inhab. | 191 | 263 | 307 | |||||||
| Greece | no. Eco-Schools/mio. inhab. | 34 | 14 | 36 | |||||||
| Portugal | no. Eco-Schools/mio. inhab. | 65 | 83 | 83 | |||||||
| Sweden | no. Eco-Schools/mio. inhab. | 174 | 201 | 220 | |||||||
| Ireland | no. Eco-Schools/mio. inhab. | 677 | 719 | 716 | |||||||
| United Kingdom | no. Eco-Schools/mio. inhab. | 250 | 286 | 284 | |||||||
| Denmark | no. Eco-Schools/mio. inhab. |


