KAZALCI OKOLJA

Environmental indicators in Slovenia


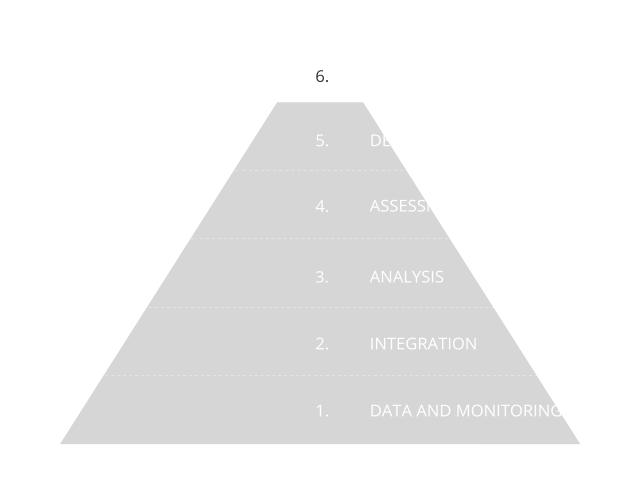
Environmental indicators are based on graphs, maps and assessments and as such present environmental trends in Slovenia. The indicators represent one of the four pillars of our environmental reporting, and are prepared in accordance with the Environmental Protection Act. The Environmental Indicators in Slovenia website enables users to browse among 180 indicators. They are based on numerical data and they indicate the state, characteristics and trends of environmental development in Slovenia. They are prepared using a systematic approach based on data and monitoring, as shown in the information pyramid.

Did you know?

Good

Households willingness to use photovoltaic systems in single-family homes has increased. The index increased by 7 index points between 2019 and 2022, reaching a value of 36 on a scale from 0 to 100 in 2022. The share of households that already use or intend to use photovoltaics in the near future has increased the most during this period. Despite the positive change, as many as a quarter of households are still hesitant or reluctant to use photovoltaics. There are no differences in willingness to use photovoltaics between regions.

Bad

Among the statistical regions of Slovenia, the Osrednjeslovenska region has the highest ecological footprint per capita (5.8 gha), while the Goriška region has the lowest (4.79 gha). The largest share of the ecological footprint in all regions is represented by the carbon footprint, contributing approximately 60%. A significant portion is also attributed to forest products (around 20%) and agricultural land (around 10%). The region with the highest biocapacity per capita is Primorsko-notranjska (8.02 gha), while Osrednjeslovenska has the lowest (1.11 gha).

Neutral

Comparison of periods 1961–1990 and 1991–2020 on the chosen representative stations around Slovenia shows decrease of heating degree days by around 10 % and multiple increase of cooling degree days. With projected continuous temperature raise until the end of 21st century, those trends are expected to continue. Thus, in Slovenia, energy demand for cooling will increase in the warmer period of the year, while the energy demand for heating will decrease in colder period of the year. Same trend is projected for Europe in general.

Neutral

Tourism in Slovenia is growing steadily. It was particularly high in the last five years before the pandemic, when Slovenia established itself as an attractive green destination. In 2021 and 2022, domestic guest arrivals and overnight stays increased due to the pandemic. In 2024, Slovenian tourism already exceeded the global and European average with an 8% increase in foreign arrivals compared to 2019.

Neutral

In 2024, we began reporting on the chemical status of groundwater for a longer six-year period, in line with the reporting cycle under the Water Framework Directive. Based on this assessment, the state adopts measures to improve water quality.

Good

Groundwater in intergranular aquifers in Slovenia is most affected by nitrate pollution, particularly in northeastern Slovenia. In contrast, groundwater in karst and fissured aquifers is less impacted due to geographical conditions, lower population density, and a smaller proportion of agricultural land.

For the period 2019–2024, poor chemical status was identified in the water bodies of the Savinja, Drava, and Mura basins. The main cause of poor chemical status in all water bodies was nitrate, with atrazine additionally contributing in the Drava basin.