KAZALCI OKOLJA

Environmental indicators in Slovenia


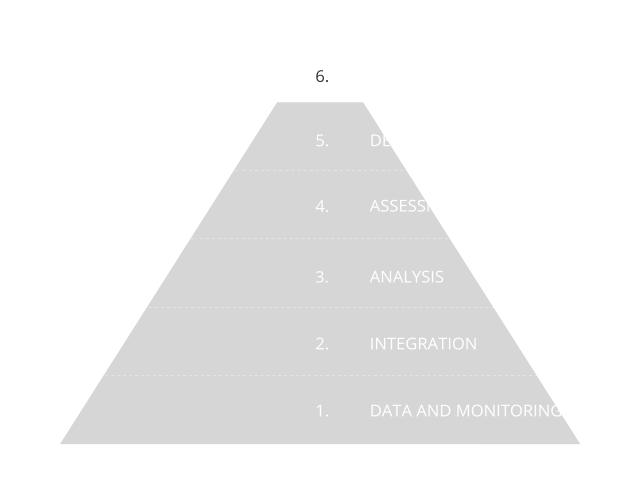
Environmental indicators are based on graphs, maps and assessments and as such present environmental trends in Slovenia. The indicators represent one of the four pillars of our environmental reporting, and are prepared in accordance with the Environmental Protection Act. The Environmental Indicators in Slovenia website enables users to browse among 180 indicators. They are based on numerical data and they indicate the state, characteristics and trends of environmental development in Slovenia. They are prepared using a systematic approach based on data and monitoring, as shown in the information pyramid.

Did you know?

Bad

Between 1980 and 2021, extreme events related to climate change in EU-27 resulted in an economic loss of EUR 560 billion, of which EUR 56.6 billion from 2021. Climate extremes are becoming more common. Without further action, even greater economic damage is expected in the future. This trend is also noticeable in Slovenia. The difference between the period 1980-2015 and 1980-2021 is as much as € 2,38 billion. In comparison to the previous period 1980-2020, the difference is € 1,01 billion.

Bad

F-gas emissions from leaks from stationary installations decreased in 2025 mainly due to lower use of refilled refrigerants. Despite the reduction distance to the indicative target for reducing emissions from the use of F-gases under the EU F-gases Regulation remained large. Compared to 2015, F-gas emissions from leaks were 23% lower in 2025, while, according to the F-gases Regulation, they should have been lower by 76%.

Good

In 2024, 83.1% of all heat in district heating (DH) systems was produced in energy-efficient district heating systems, i.e. systems meeting at least one of the criteria defined in Article 50 of the Energy Efficiency Act (ZURE). Compared with 2023, this share decreased by 4.5 percentage points. The combined share of heat from renewable energy sources and waste heat amounted to 20.5% in 2024, which was 0.7 percentage points lower than in the previous year, but 4.8 percentage points higher than in 2016.

Bad

In 2025, the leverage of incentives in the public sector amounted to 32.9 euro cents of subsidy for 1 euro of investment, which was 21 euro cents less than in 2024. The decline was due to the projects supported by the Eco Fund under the calls for co-financing new investments in the construction of highly energy-efficient, nearly zero-energy buildings of general public interest. For these projects, the leverage of incentives was only 13.3 euro cents of subsidy for 1 euro of investment, while they accounted for as much as 73% of the total value of supported investments.

Neutral

According to the projection based on existing measures, total greenhouse gas (GHG) emissions will remain at a level similar to today's until 2030 and will then begin to decline. Under the projection that includes additional measures, however, emissions will decrease dramatically – by 35% by 2030 and by 88% by 2050. The projections indicate that, with the intensive implementation of measures, it is possible to achieve the targets set for reducing total GHG emissions, as well as emissions from sources not covered by the Emissions Trading System (ETS).

Good

Slovenia has a relatively high level of energy intensity, although it has been declining, particularly rapidly in recent years. Between 2005 and 2023, energy intensity decreased at an average annual rate of 3.2%. In 2024, energy intensity increased for the first time since 2016, rising by 2.1%. In 2024, Slovenia’s energy intensity was 37% higher than the EU-27 average, which is 15 percentage points less than in 2005.