KAZALCI OKOLJA

Environmental indicators in Slovenia


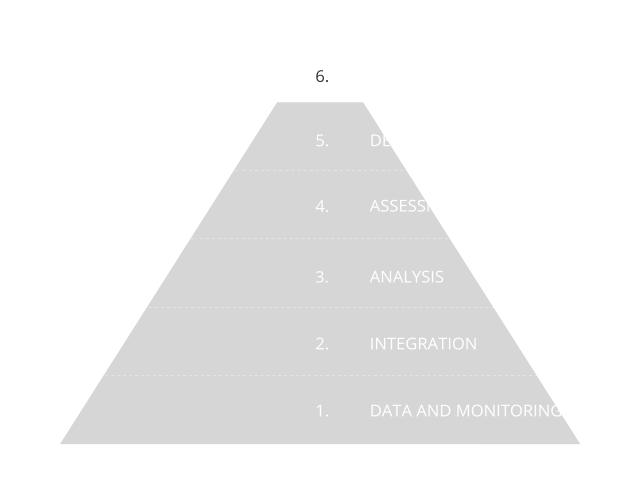
Environmental indicators are based on graphs, maps and assessments and as such present environmental trends in Slovenia. The indicators represent one of the four pillars of our environmental reporting, and are prepared in accordance with the Environmental Protection Act. The Environmental Indicators in Slovenia website enables users to browse among 180 indicators. They are based on numerical data and they indicate the state, characteristics and trends of environmental development in Slovenia. They are prepared using a systematic approach based on data and monitoring, as shown in the information pyramid.

Did you know?

Bad

The eco-innovation index shows the performance of individual Member States in the various components of eco-innovation compared to the EU average, and presents their strengths and weaknesses. The overall Eco-innovation Index 2019 for Slovenia is 94, placing Slovenia on 15th rank and below the EU average. Slovenia composite index has significantly deteriorated compared to 2017, when it was at 115; placing Slovenia just behind the leading eco-innovative countries.

Good

Net greenhouse gas (GHG) emissions in the LULUCF sector amounted to -4.452 kt CO2 eq in 2024, indicating that the sector was a net sink. Compared with 2005, the size of the net sink was 41% lower, mainly due to the impacts of natural disturbances in forests and increased harvesting levels over the past decade. According to the Slovenian Forest Service, timber harvesting in 2025 decreased by approximately 13% compared to 2024, while the share of sanitary fellings remained high, accounting for around 32% of total recorded harvesting.

Bad

Specific CO₂ emissions from new passenger cars amounted to 127 g CO₂/km in 2024 and decreased to 117 g CO₂/km in 2025. The increase in the share of electric passenger cars contributed significantly to this reduction. Nevertheless, the target value for the 2025–2029 period, set at 93.6 g CO₂/km, has not yet been achieved.

In 2024, average CO₂ emissions from all passenger cars amounted to 157.5 g CO₂/km and changed only marginally compared with 2023. The target value for 2020, set at 152 g CO₂/km, therefore remained unmet.

Neutral

According to the short-term projection, ESR emissions in 2025 were 0.6% higher than actual emissions in 2024. The difference can be attributed mainly to the industry and transport sectors, and to a lesser extent to the electricity and heat production and consumer goods sectors. Compared to the annual target for 2025 under Regulation (EU) 2023/857, emissions were higher by 318 kt CO2 eq. or 3.1%, and compared to the indicative annual value from the NECP 2024, they were higher by 934 kt CO2 eq. or 9.7%.

Neutral

According to the projection based on existing measures, total greenhouse gas (GHG) emissions will remain at a level similar to today's until 2030 and will then begin to decline. Under the projection that includes additional measures, however, emissions will decrease dramatically – by 35% by 2030 and by 88% by 2050. The projections indicate that, with the intensive implementation of measures, it is possible to achieve the targets set for reducing total GHG emissions, as well as emissions from sources not covered by the Emissions Trading System (ETS).

Good

Slovenia has a relatively high level of energy intensity, although it has been declining, particularly rapidly in recent years. Between 2005 and 2023, energy intensity decreased at an average annual rate of 3.2%. In 2024, energy intensity increased for the first time since 2016, rising by 2.1%. In 2024, Slovenia’s energy intensity was 37% higher than the EU-27 average, which is 15 percentage points less than in 2005.