KAZALCI OKOLJA

Environmental indicators in Slovenia


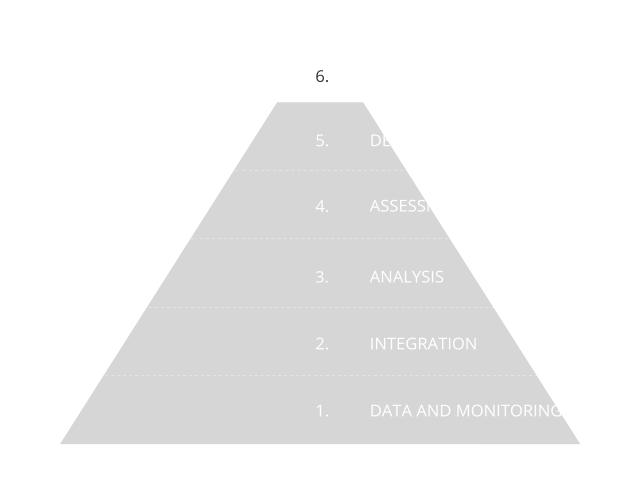
Environmental indicators are based on graphs, maps and assessments and as such present environmental trends in Slovenia. The indicators represent one of the four pillars of our environmental reporting, and are prepared in accordance with the Environmental Protection Act. The Environmental Indicators in Slovenia website enables users to browse among 180 indicators. They are based on numerical data and they indicate the state, characteristics and trends of environmental development in Slovenia. They are prepared using a systematic approach based on data and monitoring, as shown in the information pyramid.

Did you know?

Neutral

The total number of varieties listed in the National List of Varieties for cereals, corn, and potatoes has decreased since 2011, while the number of oilseed varieties has steadily increased over the same period, mainly due to domestic varieties registered as conservation varieties and the registration of a larger number of foreign sunflower hybrids. In other crops the number has remained at the similar level. For rye and oats, the proportion of the five most common varieties is 100%.

Neutral

The emission productivity in Slovenia improved in 2023 and amounted to 3,18 EUR2010/kg CO2 ekv. Despite the progress made in recent years, is, however, the progress in emission productivity in Slovenia when compared to the European Union (EU), still relatively slow, thus there is a need to further strengthen the connection between economic development and measures for reducing GHG emissions.

Neutral

The implicit tax rate on energy in Slovenia amounted to 247 €/toe in 2023, which is 4% higher than in the previous year but still 17% lower than in 2016, when it reached its peak for the period 2012–2023. Compared with the EU-27, it was 3.6% above the EU average in 2023, while it was below the European average only in the years 2020–2022 due to temporary crisis-related measures. In addition to tax policy, the rate is also influenced by changes in the structure of energy consumption and energy efficiency.

Good

In 2023, energy efficient district heating (DH) systems, i.e. systems that meet one of the criteria defined in Article 50 of the Act on Energy Efficiency, produced 87,7% of all heat in DO systems, which is the highest value in the observed period. The total share of heat from renewable energy sources (RES) and waste heat amounted to 21,2% in 2023. It increased by 0.5 percentage points compared to the previous year, and by 5.5 percentage points compared to 2016.

Good

According to the data for 2023, GHG emissions per unit of electricity produced amounted to 166 gCO2/kWh. In the period 1992–2023, the intensity of GHG emissions decreased by 62,4%. Compared to the EU-27 average, intensity of GHG emissions in Slovenia in 2023 was 19,8% lower.

Good

Energy efficiency in industry improved significantly between 2005 and 2023, with a 43% increase in 2023 compared to 2005. The chemical industry, machinery and equipment manufacturing, non-ferrous metals, and paper manufacturing contributed the most to the improvement, while steel production and non-metallic mineral products contributed the least.