KAZALCI OKOLJA

Environmental indicators in Slovenia


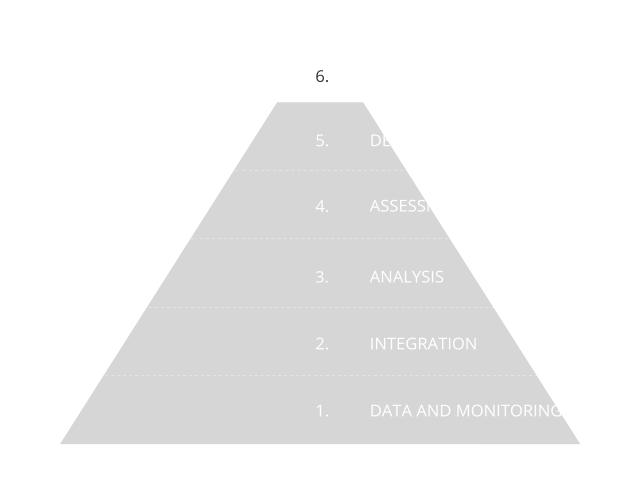
Environmental indicators are based on graphs, maps and assessments and as such present environmental trends in Slovenia. The indicators represent one of the four pillars of our environmental reporting, and are prepared in accordance with the Environmental Protection Act. The Environmental Indicators in Slovenia website enables users to browse among 180 indicators. They are based on numerical data and they indicate the state, characteristics and trends of environmental development in Slovenia. They are prepared using a systematic approach based on data and monitoring, as shown in the information pyramid.

Did you know?

Neutral

Both the residents of the EU-27 countries and the residents of Slovenia are only partially aware of the problem of increasing transport and its consequences for the environment and health. Public awareness of the impact of transport on the environment is still relatively low, although the differences between European countries are considerable. People's awareness of the environmental problems of transport does not automatically lead to changing their travel habits, even though this would contribute to their better health.

Bad

Final energy consumption in buildings amounted to 1,475 ktoe in 2024 and was 2% above the annual indicative value, which was therefore not achieved. Compared to the previous year, it remained at approximately the same level, and compared to 2005, it decreased by 23%. Greenhouse gas GHG emissions in buildings amounted to 1,100 kt CO₂ eq in 2024, thus the annual indicative value was also not achieved.

Bad

The total annual final energy savings due to the implementation of energy efficiency (EE) and renewable energy source (RES) measures in the residential sector amounted to 1,319 GWh in 2025, and the total annual CO2 emissions reduction was 306 kt. Compared to the previous year, annual energy savings decreased by 39%, while the reduction in CO2 emissions fell by as much as 45%. Lower values were only achieved in the period before 2019.

Bad

In 2025, the leverage of incentives in the public sector amounted to 32.9 euro cents of subsidy for 1 euro of investment, which was 21 euro cents less than in 2024. The decline was due to the projects supported by the Eco Fund under the calls for co-financing new investments in the construction of highly energy-efficient, nearly zero-energy buildings of general public interest. For these projects, the leverage of incentives was only 13.3 euro cents of subsidy for 1 euro of investment, while they accounted for as much as 73% of the total value of supported investments.

Good

Slovenia has a relatively high level of energy intensity, although it has been declining, particularly rapidly in recent years. Between 2005 and 2023, energy intensity decreased at an average annual rate of 3.2%. In 2024, energy intensity increased for the first time since 2016, rising by 2.1%. In 2024, Slovenia’s energy intensity was 37% higher than the EU-27 average, which is 15 percentage points less than in 2005.

Bad

In 2024, the share of RES in transport, after an increase in 2023, dropped again and amounted to 9,2%. With this, it was 1,6 percentage points behind the non-binding 2024 target from the updated National Energy and Climate Plan (NECP 2024).