KAZALCI OKOLJA

Environmental indicators in Slovenia


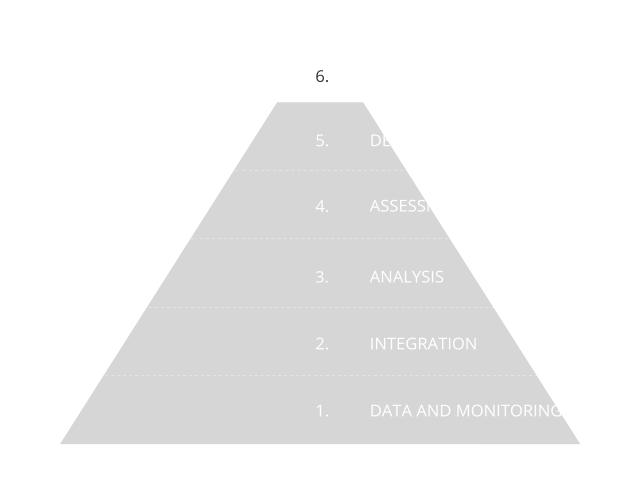
Environmental indicators are based on graphs, maps and assessments and as such present environmental trends in Slovenia. The indicators represent one of the four pillars of our environmental reporting, and are prepared in accordance with the Environmental Protection Act. The Environmental Indicators in Slovenia website enables users to browse among 180 indicators. They are based on numerical data and they indicate the state, characteristics and trends of environmental development in Slovenia. They are prepared using a systematic approach based on data and monitoring, as shown in the information pyramid.

Did you know?

Bad

The eco-innovation index shows the performance of individual Member States in the various components of eco-innovation compared to the EU average, and presents their strengths and weaknesses. The overall Eco-innovation Index 2019 for Slovenia is 94, placing Slovenia on 15th rank and below the EU average. Slovenia composite index has significantly deteriorated compared to 2017, when it was at 115; placing Slovenia just behind the leading eco-innovative countries.

Neutral

Overall energy efficiency of final energy consumption improved by 30 % between 2005 and 2024. The industrial sector contributed the most to this improvement, followed by households, while the transport sector contributed by far the least. In 2024, energy savings compared with 2005 amounted to 1,724 ktoe, equivalent to 44 % of the final energy consumption of the industry, transport and household sectors.

Bad

In 2025, 57,118 m2 of total floor area of public sector buildings were renovated within the cohesion policy programs, which was 38% less than in the previous year and the lowest level recorded in the 2018–2025 period. In line with the targets set out in the Long-term strategy for energy renovation of buildings by 2050, the energy renovation of 1,150,000 m² of public sector building floor area was planned for the 2021–2025 period; however, only just over half of this amount, or 578,145 m², was actually renovated.

Good

According to the data for 2024, GHG emissions per unit of electricity produced amounted to 175 gCO2/kWh. In the period 1992–2024, the intensity of GHG emissions decreased by 60,1%. Compared to the EU-27 average, intensity of GHG emissions in Slovenia in 2024 was 4,6% lower.

Bad

The share of renewable energy sources (RES) in the use of fuels in industry amounted to 10,7% in 2024, which was 7.1 percentage points behind the annual indicative target value. The 2024 indicative target was thus not achieved. In order to achieve the target of 30% of RES in the use of fuels in industry in 2030, the share of RES will have to increase by 19.3 percentage points or by about approximately 3.2 percentage points per year.

Bad

In 2025, the amount of incentives for the implementation of measures related to energy efficiency (EE) and renewable energy sources (RES) in non-ETS industry amounted to EUR 1.7 million. This was 53% higher than in the previous year. This amount only takes into account the incentives of the Eco Fund, as other programmes currently do not allow monitoring of the effects related to climate targets for the co-financed projects in industry.