[KM12] Specialisation and diversification of agriculture

Key message

Slovenia belongs to the EU Member States with a lower level of specialization in agriculture. This is reflected in the number of specialized farms and the surface area of agricultural land treated by these holdings. Specialized farms in Slovenia generate a smaller share of standard output than the average in the European Union, which indicates that the processes of concentration and specialization of agricultural production in Slovenia is slower than in European Union.
Definition
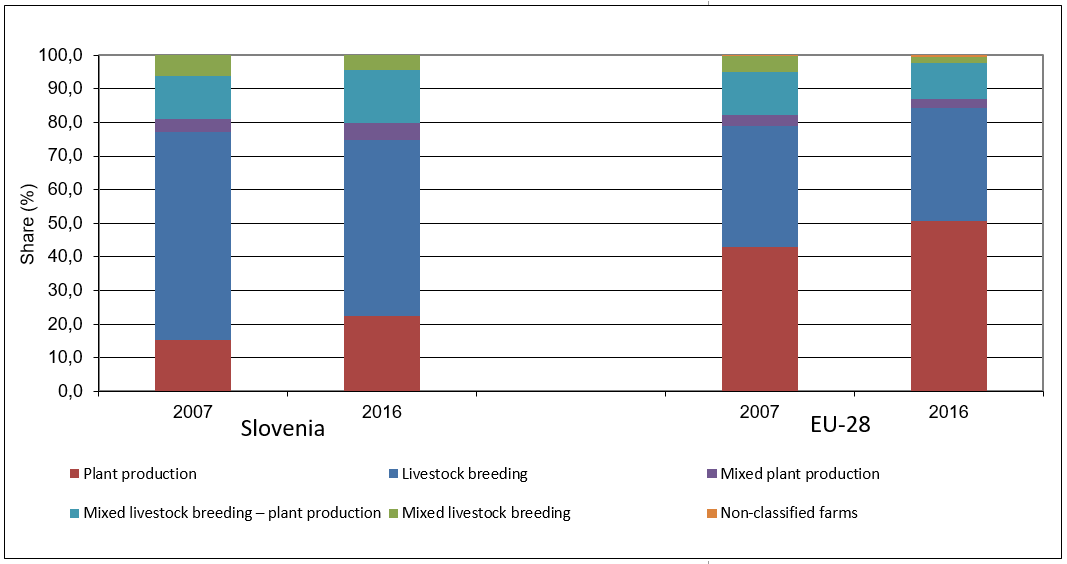
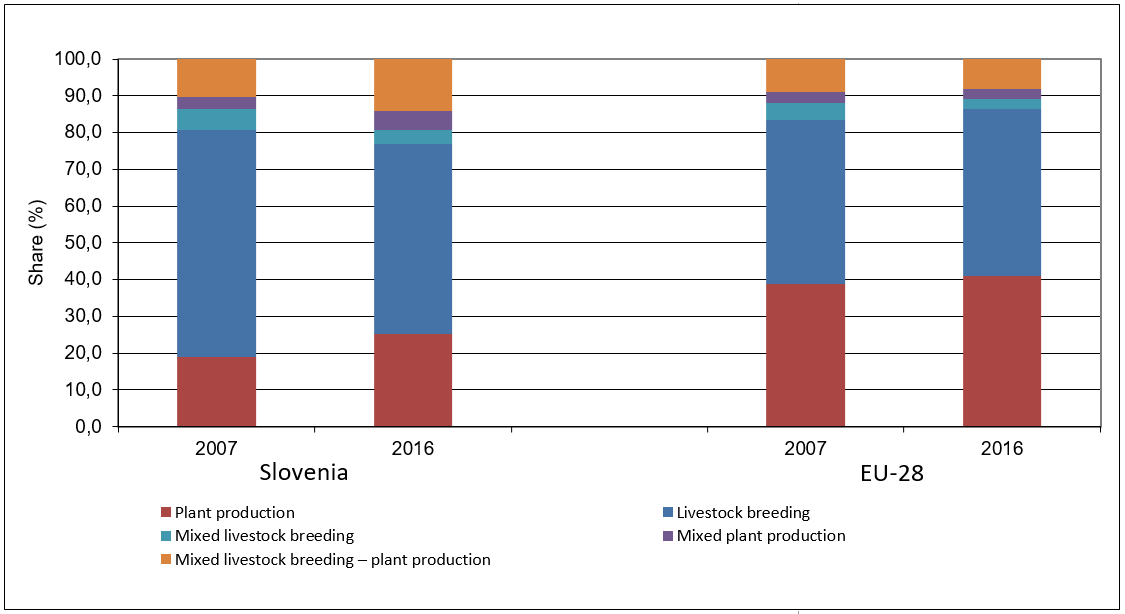
The specialization of agriculture is directing the agricultural production in a particular agricultural sector. In the production-economic sense, it can be defined as the predominance of an individual type of production or service in the value of the income of agricultural holdings. The main drivers of agricultural specialization are economic efficiency and market and price conditions. Specialization enables greater production efficiency, which is mainly reflected in the increase in the level of production per production unit - intensity. The level of specialization of agriculture in Slovenia is analyzed for the period 2007–2016 and is shown by:
- the share of agricultural holdings by individual types of farming,
- the share of the area of agricultural land in use by individual types of
agricultural holdings,
- share and movement of the value of economic size on agricultural holdings
by individual types of farming.
Charts
DATA COLLECTION: 30. 9. 2018 ()
Calculations by AIS
| 2007[%] | 2010[%] | 2016[%] | |
|---|---|---|---|
| Specialist field crops | 12.54 | 17.12 | 19.19 |
| Specialist horticulture | 0.68 | 0.70 | 0.62 |
| Specialist permanent crops | 9.01 | 11.64 | 13.15 |
| Specialist grazing livestock | 44.15 | 40.04 | 35.74 |
| Specialist granivores | 1.81 | 1.22 | 0.59 |
| Mixed cropping | 8.14 | 7.39 | 8.18 |
| Mixed livestock holdings | 7.42 | 6.60 | 5.43 |
| Mixed crops - livestock | 16.25 | 15.29 | 17.11 |
Calculations by AIS
| 2007[%] | 2010[%] | 2016[%] | |
|---|---|---|---|
| Specialist field crops | 10.59 | 13.32 | 16.70 |
| Specialist horticulture | 0.55 | 0.46 | 0.35 |
| Specialist permanent crops | 4.20 | 4.70 | 5.87 |
| Specialist grazing livestock | 59.60 | 55.64 | 50.55 |
| Specialist granivores | 2.37 | 2.63 | 1.09 |
| Mixed cropping | 3.87 | 3.75 | 4.91 |
| Mixed livestock holdings | 6.08 | 5.59 | 4.39 |
| Mixed crops - livestock | 12.75 | 13.92 | 16.13 |
Calculations by AIS
| 2007[%] | 2010[%] | 2016[%] | |
|---|---|---|---|
| Specialist field crops | 4.29 | 6.86 | 9.15 |
| Specialist horticulture | 8.52 | 2.98 | 2.38 |
| Specialist permanent crops | 6.16 | 8.34 | 13.81 |
| Specialist grazing livestock | 49.38 | 50.14 | 43.49 |
| Specialist granivores | 12.31 | 10.12 | 8.09 |
| Mixed cropping | 3.19 | 3.45 | 5.22 |
| Mixed livestock holdings | 5.74 | 5.23 | 3.69 |
| Mixed crops - livestock | 10.40 | 12.86 | 14.17 |
Calculations by AIS
| Plant production [%] | Livestock breeding [%] | Mixed livestock breeding [%] | Mixed plant production [%] | Mixed livestock breeding – plant production [%] | Non-classified farms [%] | |
|---|---|---|---|---|---|---|
| 2007 | 20.60 | 45.59 | 8.24 | 8.85 | 16.66 | 0.05 |
| 2016 | 32.95 | 36.32 | 5.42 | 8.14 | 17.12 | 0.04 |
| 2007 | 44.11 | 25.64 | 7.21 | 4.94 | 15.94 | 2.15 |
| 2016 | 52.45 | 25.15 | 3.46 | 4.75 | 12.90 | 1.30 |
Calculations by AIS
| Plant production [%] | Livestock breeding [%] | Mixed livestock breeding [%] | Mixed plant production [%] | Mixed livestock breeding – plant production [%] | |
|---|---|---|---|---|---|
| 2007 | 15.33 | 61.97 | 6.08 | 3.87 | 12.75 |
| 2016 | 22.52 | 52.36 | 4.34 | 4.83 | 15.95 |
| 2007 | 43.08 | 35.83 | 4.67 | 3.25 | 12.93 |
| 2016 | 50.64 | 33.69 | 1.99 | 2.71 | 10.60 |
Calculations by AIS
| Plant production [%] | Livestock breeding [%] | Mixed livestock breeding [%] | Mixed plant production [%] | Mixed livestock breeding – plant production [%] | |
|---|---|---|---|---|---|
| 2007 | 18.98 | 61.69 | 5.74 | 3.19 | 10.40 |
| 2016 | 25.35 | 51.58 | 3.69 | 5.22 | 14.17 |
| 2007 | 38.89 | 44.39 | 4.67 | 2.95 | 9.10 |
| 2016 | 40.96 | 45.55 | 2.63 | 2.63 | 8.23 |
Goals
Specialization as a development factor does not occupy a significant place in the strategic and program documents of European agricultural policy. Moreover, in most documents, in connection with the intensification, it is mentioned as one of the agricultural factors that most negatively affect the quality of the environment. These impacts are most pronounced in land use change, which can lead to lower plant and animal diversity. Due to the increased concentration of production within a small and limited number of agricultural products, management systems and the intensity of land use can change significantly. Although specialization in some cases (e.g. focus on extensive cattle and small ruminant farming in mountainous and other areas with limited factors) can improve the environmental conditions for the conservation of high natural value agricultural land, most environmental as well as agricultural strategic documents point to the impending the danger of over-specialization in agriculture.


