[PR15] Progress in charge levels

Key message

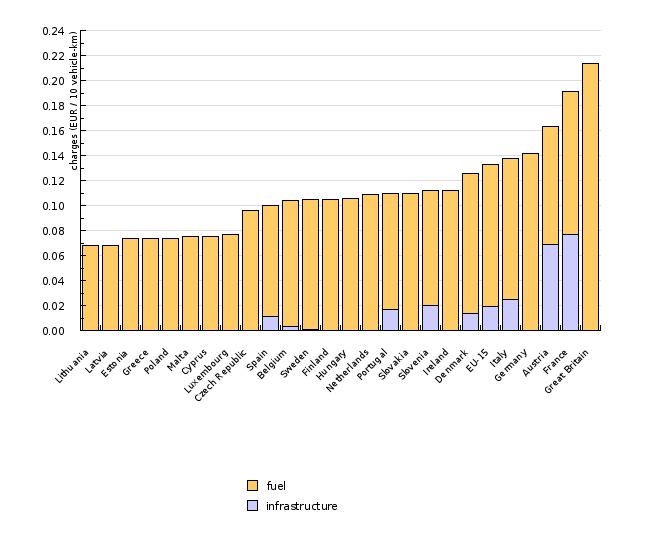
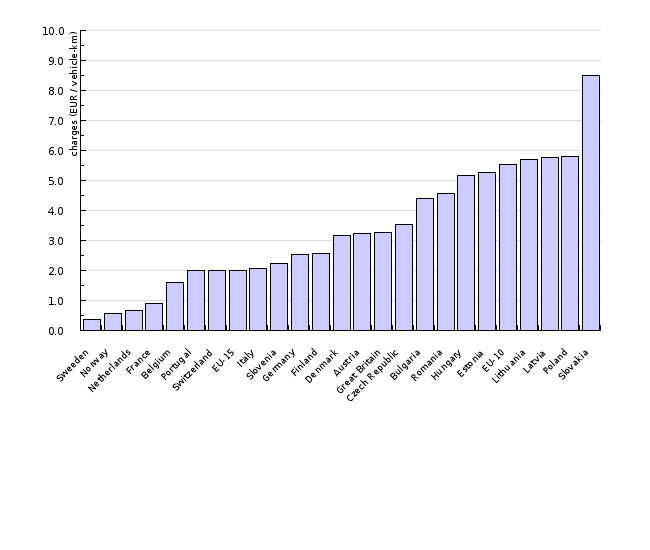
In comparison with the European average, the levels of transport charges in Slovenia are relatively low. The charges for the road freight transport subsystem are somewhere at the average level, while in the rail freight transport subsystem substantially below the average level of other European countries.
Definition
The indicator shows the levels of transport charges for road and rail freight transport subsystems by individual European countries. The data for the road freight transport subsystem refers to 2004, the data for the rail freight transport subsystem to 2005.
Charts
TERM 2006 22 – Progress in charge levels, European Environmenta Agency, 2006.
| Lithuania | Latvia | Estonia | Greece | Poland | Malta | Cyprus | Luxembourg | Czech Republic | Spain | ||
|---|---|---|---|---|---|---|---|---|---|---|---|
| infrastructure | EUR / 10 vehicle-km | 0 | |||||||||
| fuel | EUR / 10 vehicle-km | 0.1 | 0.1 | 0.1 | 0.1 | 0.1 | 0.1 | 0.1 | 0.1 | 0.1 | 0.1 |
| Belgium | Sweden | Finland | Hungary | Netherlands | Portugal | Slovakia | Slovenia | Ireland | Denmark | ||
| infrastructure | EUR / 10 vehicle-km | 0 | 0 | 0 | 0 | 0 | |||||
| fuel | EUR / 10 vehicle-km | 0.1 | 0.1 | 0.1 | 0.1 | 0.1 | 0.1 | 0.1 | 0.1 | 0.1 | 0.1 |
| EU-15 | Italy | Germany | Austria | France | Great Britain | ||||||
| infrastructure | EUR / 10 vehicle-km | 0 | 0 | 0.1 | 0.1 | ||||||
| fuel | EUR / 10 vehicle-km | 0.1 | 0.1 | 0.1 | 0.1 | 0.1 | 0.2 |
TERM 2006 22 – Progress in charge levels, European Environment Agency, 2006.
| Sweeden | Norway | Netherlands | France | Belgium | Portugal | Switzerland | EU-15 | Italy | Slovenia | ||
|---|---|---|---|---|---|---|---|---|---|---|---|
| infrastructure | EUR / vehicle-km | 0.4 | 0.6 | 0.7 | 0.9 | 1.6 | 2 | 2 | 2 | 2.1 | 2.2 |
| Germany | Finland | Denmark | Austria | Great Britain | Czech Republic | Bulgaria | Romania | Hungary | Estonia | ||
| infrastructure | EUR / vehicle-km | 2.6 | 2.6 | 3.2 | 3.2 | 3.3 | 3.5 | 4.4 | 4.6 | 5.2 | 5.3 |
| EU-10 | Lithuania | Latvia | Poland | Slovakia | |||||||
| infrastructure | EUR / vehicle-km | 5.5 | 5.7 | 5.8 | 5.8 | 8.5 |
Goals
The introduction of transport infrastructure charges following the principle of social marginal costs (costs by the infrastructure user to himself/herself, other infrastructure users and society in general).
Comment
An objective of the transport pricing policy is to maximise socio-economic welfare, i.e. reduce the negative impacts of transport whilst respecting its benefits. Most EU transport policy documents implicitly or explicitly contain this objective. To reach this, transport charges should reflect the social costs (including external transport costs) in both level and structure (EEA, 2006).
The charge levels tell us how much transport is charged. This data is relevant because in transport charges may be levied on transport users and hence reduce the demand for the use of an individual transport mode. This could eventually lead to either a modal shift, or to a net reduction in transport demand due to higher prices. Both effects reduce the negative impacts of transport on the environment (EEA, 2006). For road transport, precise trends could not be analysed due to the fact that reliable data on mileages is unavailable. It is therefore unclear whether increased toll revenues in countries are due to an increase in charges per kilometre or a general increase in vehicle mileage. It is clear however, that with new transport charging schemes being introduced, the average transport charge level is increasing (EEA, 2006).
Road freight transport
The charges levied for HDV transport in the EU-15 countries are, with the exception of the United Kingdom and France, well below the best case estimates for external transport costs. Here, Slovenia belongs to the countries with an average level of transport charges. At the European level, a positive fact is that more and more countries are introducing distance-based variable charging, which is fair and contributes to more efficient charging of transport costs.
Rail freight transport
In the EU, there are considerable differences between the infrastructure charges levied on rail freight transport, but with the exception of Slovakia, they are generally well below the average marginal external cost estimate for this transport mode. There is a striking difference in the charge levels on rail freight transport in the EU-15 countries and those in the new Member States, with the former having substantially higher charge levels. This may be due to differences in rail infrastructure cost levels. According to this data, Slovenia belongs to countries with low charges levied on transport (EEA, 2006).
Methodology
Data for Slovenia and other countries:
Objectives summarised by: Resolution on Transport Policy of the Republic of Slovenia. OG RS, no. 58/2006.
Source database or source: TERM 2006 22 – Progress in charge levels, Indicator fact sheet (19 August 2009).
Data administrator: European Environment Agency (EEA).
Date of acquisition for this indicator: 19 August 2009.
Methodology and frequency of data collection for the indicator: The data is collected ad hoc from various sources. The data for road transport refers only to 2004 and for rail transport to 2005.
Data processing methodology: Infrastructure charge levels for road infrastructure are estimated by using estimates for mileages based on the best available information.
Geographical coverage: The EU-15 group is composed of the following countries: Belgium, Denmark, Germany, Greece, Spain, France, Ireland, Italy, Luxembourg, the Netherlands, Austria, Portugal, Finland, Sweden and the United Kingdom. The EU-10 group is composed of the following countries: Cyprus, Malta, Estonia, Lithuania, Latvia, Poland, Czech Republic, Slovakia, Slovenia, and Hungary.
Information concerning data quality:
- Advantages and disadvantages (at data level): The rare data on mileages and fuel efficiency prevent the implementation of a trend analysis. The available data is highly manipulated.
- Relevance, accuracy, robustness, uncertainty: 3
Reliability of the indicator (archive data): The data refers only to 2004 (road transport) and to 2005 (rail transport).
Uncertainty of the indicator (scenarios/projections): Projections have not been prepared.
- Overall assessment (1 = no major comments, 3 = data to be considered with reservation): 3
Relevance: 1
Accuracy: 3 (data on marine and air transport is hardly available)
Completeness over time: 3 (no time series can be made)
Completeness over space: 3(insufficient data in some countries)
Other sources and literature:
- EEA, 2006. TERM 2006 22 – Progress in charge levels. Indicator fact sheet, European Environment Agency.


