[EN32] Energy efficiency and energy use in sectors of final energy consumption

Key message

Most energy in transport is used in passenger cars, followed by cargo vehicles with an increasing share. Efficiency of energy use, excluding the influence of transit transport, is improving, but the improvements are too slow.
Most energy in households is used for heating. In the period 2009 – 2012, the efficiency of energy use increased considerably, mostly due to the increased efficiency of heating and large household appliances.
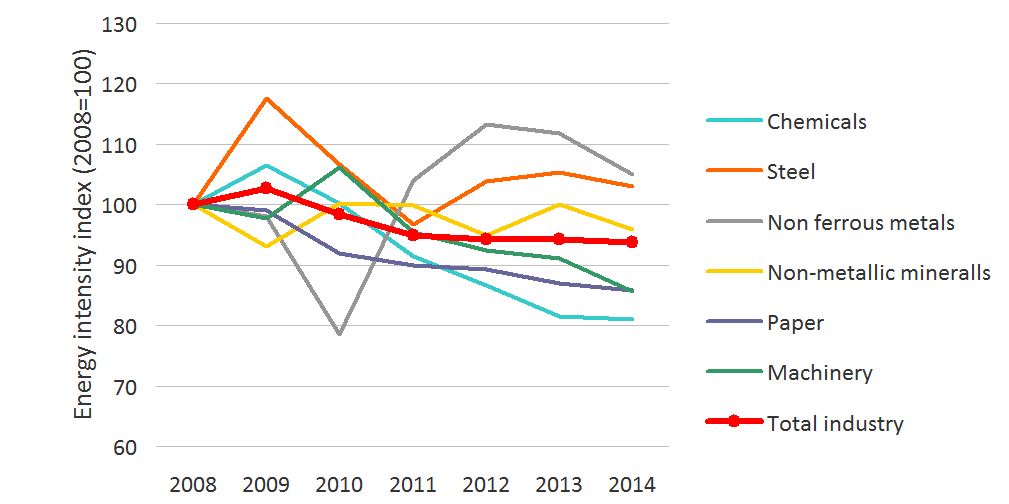
In industry, most energy is used in the production of metals. Efficiency of energy use in industry in general was increasing until 2011, after which it stabilised with very different and dynamic trends in individual sectors.
Definition
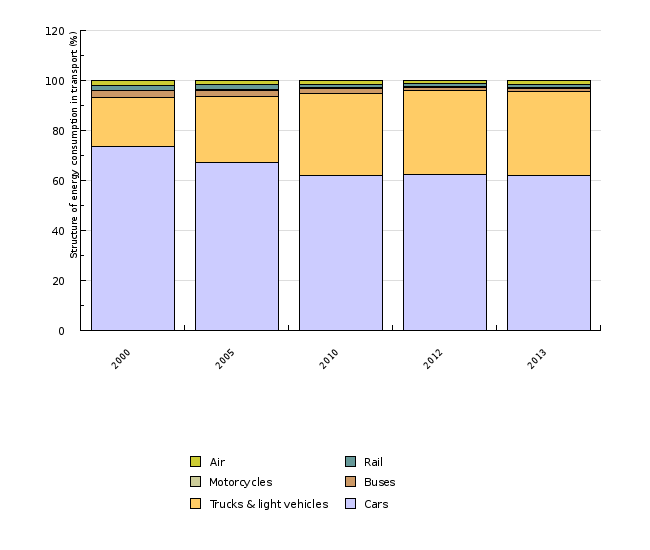
This indicator shows the division of energy consumption in transport with regard to transport mode (road, rail, air), the division of energy consumption in road transport by vehicle type (cars, cargo vehicles, buses, motorcycles) and energy efficiency in transport.
The indicator also shows the division of energy consumption in households with regard to the purpose of consumption (heating, hot water, cooking, using appliances, etc.). In addition, the indicator analyses energy efficiency in households.
The indicator also shows the division of energy consumption in industry with regard to sector: the chemical industry, the manufacture of metals, the manufacture of non-metallic mineral products, the paper industry, the manufacture of machines and equipment, the food and tobacco industry, the textile industry, the wood processing industry, the manufacture of transport equipment, other industry, extraction of ores and minerals and construction, as well as energy efficiency in industry, which is measured by the ODEX index.
Energy efficiency affects energy consumption. Increased energy efficiency (with the same level of activity) results in reduced energy consumption. When increased energy efficiency causes increased activity, it is the result of the 'rebound effect'.
Charts
Slovenian Environment Agency, 2015; Statistical office RS, 2015
| 2000 | 2005 | 2010 | 2012 | 2013 | ||
|---|---|---|---|---|---|---|
| Cars | % | 73.6 | 67.4 | 61.9 | 62.2 | 62.1 |
| Trucks & light vehicles | % | 19.5 | 26.4 | 32.9 | 33.6 | 33.6 |
| Buses | % | 2.7 | 2.4 | 1.9 | 1.3 | 1.2 |
| Motorcycles | % | 0.1 | 0.3 | 0.4 | 0.4 | 0.4 |
| Rail | % | 1.9 | 1.9 | 1.3 | 1.2 | 1.2 |
| Air | % | 2.1 | 1.6 | 1.6 | 1.3 | 1.5 |
Slovenian Environment Agency, 2015; Jožef Stefan Institute, 2015
| 2000 | 2001 | 2002 | 2003 | 2004 | 2005 | 2006 | 2007 | 2008 | 2009 | ||
|---|---|---|---|---|---|---|---|---|---|---|---|
| Transport - overall | 2000=100 | 100 | 103 | 109 | 107 | 107 | 102 | 103 | 108 | 112 | 108 |
| Cars | 2000=100 | 100 | 101 | 103 | 101 | 101 | 100 | 100 | 99 | 99 | 95 |
| Trucks & light vehicles | 2000=100 | 100 | 109 | 128 | 132 | 130 | 111 | 114 | 136 | 153 | 144 |
| 2010 | 2011 | 2012 | 2013 | ||||||||
| Transport - overall | 2000=100 | 112 | 114 | 114 | 115 | ||||||
| Cars | 2000=100 | 101 | 99 | 97 | 98 | ||||||
| Trucks & light vehicles | 2000=100 | 143 | 158 | 162 | 161 |
Slovenian Environment Agency, 2015; Jožef Stefan Institute, 2015
| 2000 | 2001 | 2002 | 2003 | 2004 | 2005 | 2006 | 2007 | 2008 | 2009 | ||
|---|---|---|---|---|---|---|---|---|---|---|---|
| Transport - overall | 2000=100 | 100 | 103 | 109 | 107 | 107 | 101 | 98 | 98 | 96 | 93 |
| Cars | 2000=100 | 100 | 101 | 103 | 101 | 101 | 100 | 100 | 99 | 99 | 95 |
| Trucks & light vehicles | 2000=100 | 100 | 109 | 128 | 132 | 130 | 106 | 97 | 97 | 93 | 91 |
| 2010 | 2011 | 2012 | 2013 | ||||||||
| Transport - overall | 2000=100 | 98 | 95 | 93 | 94 | ||||||
| Cars | 2000=100 | 101 | 99 | 98 | 99 | ||||||
| Trucks & light vehicles | 2000=100 | 94 | 91 | 87 | 87 |
EEA, 2015
| 2004 | 2005 | 2006 | 2007 | 2008 | 2009 | 2010 | 2011 | 2012 | 2013 | ||
|---|---|---|---|---|---|---|---|---|---|---|---|
| Slovenia | gCO2/km | 153 | 157 | 155 | 156 | 156 | 152 | 144 | 140 | 133 | 126 |
| 2014 | |||||||||||
| Slovenia | gCO2/km | 121 |
Jožef Stefan Institute, 2015
| 2009 | 2010 | 2011 | 2012 | 2013 | 2014 | ||
|---|---|---|---|---|---|---|---|
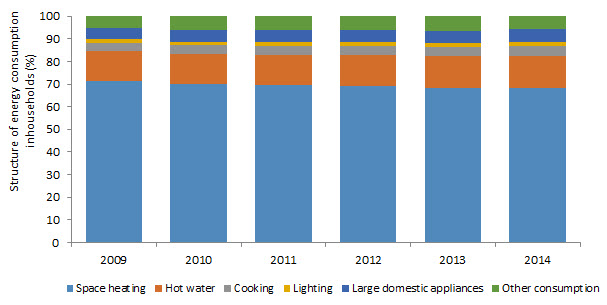
| Space heating | % | 71.5 | 70 | 69.5 | 69 | 68.3 | 68.1 |
| Hot water | % | 12.9 | 13.4 | 13.6 | 13.8 | 14 | 14.4 |
| Cooking | % | 3.7 | 3.8 | 3.9 | 4.1 | 4.3 | 4.5 |
| Lighting | % | 1.7 | 1.6 | 1.6 | 1.6 | 1.6 | 1.6 |
| Large domestic appliances | % | 5.1 | 5.2 | 5.3 | 5.4 | 5.4 | 5.6 |
| Other cosnumptino | % | 5.1 | 6.1 | 6.1 | 6.1 | 6.4 | 5.8 |
Jožef Stefan Institute, 2015
| 2009 | 2010 | 2011 | 2012 | 2013 | 2014 | ||
|---|---|---|---|---|---|---|---|
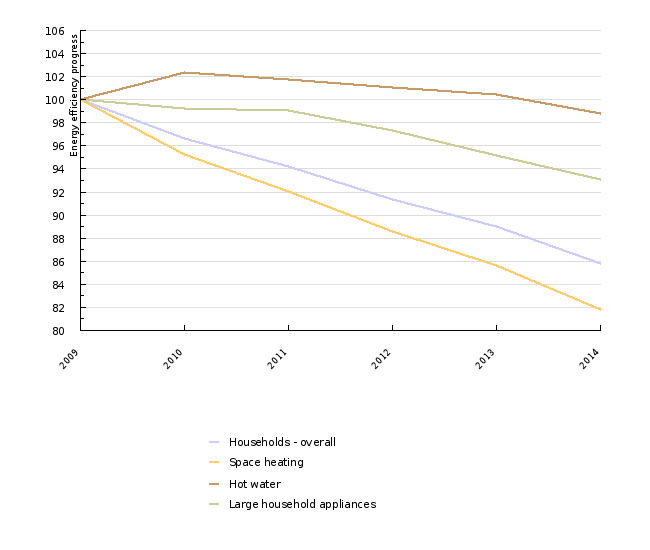
| Households - overall | 2009=100 | 100 | 97 | 94 | 91 | 89 | 86 |
| Space heating | 2009=100 | 100 | 95 | 92 | 89 | 86 | 82 |
| Hot water | 2009=100 | 100 | 102 | 102 | 101 | 100 | 99 |
| Large household appliances | 2009=100 | 100 | 99 | 99 | 97 | 95 | 93 |
Jožef Stefan Institute, 2015
| 2009 | 2010 | 2011 | 2012 | 2013 | 2014 | ||
|---|---|---|---|---|---|---|---|
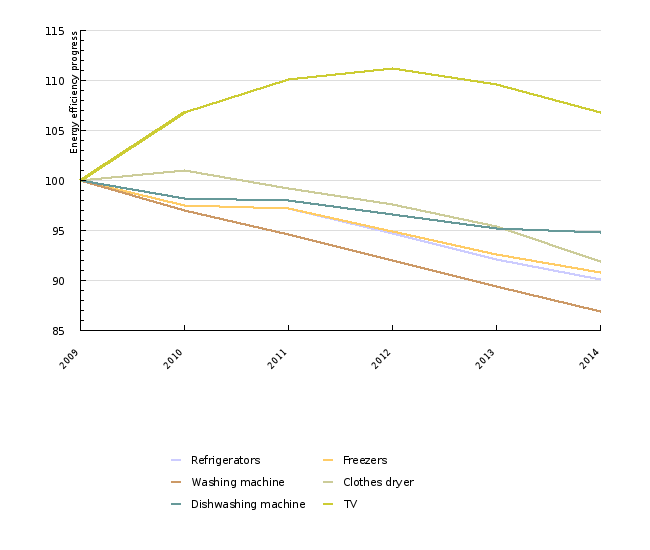
| Refrigerators | 2009=100 | 100 | 97.5 | 97.2 | 94.7 | 92.1 | 90.1 |
| Freezers | 2009=100 | 100 | 97.5 | 97.2 | 94.9 | 92.6 | 90.8 |
| Washing machine | 2009=100 | 100 | 97 | 94.6 | 92 | 89.4 | 86.9 |
| Clothes dryer | 2009=100 | 100 | 101 | 99.2 | 97.6 | 95.4 | 91.9 |
| Dishwashing machine | 2009=100 | 100 | 98.2 | 98 | 96.6 | 95.2 | 94.8 |
| TV | 2009=100 | 100 | 106.8 | 110.1 | 111.2 | 109.6 | 106.8 |
Eurostat, 2015; Statistical office RS, 2015
| 2008 | 2010 | 2013 | 2014 | ||
|---|---|---|---|---|---|
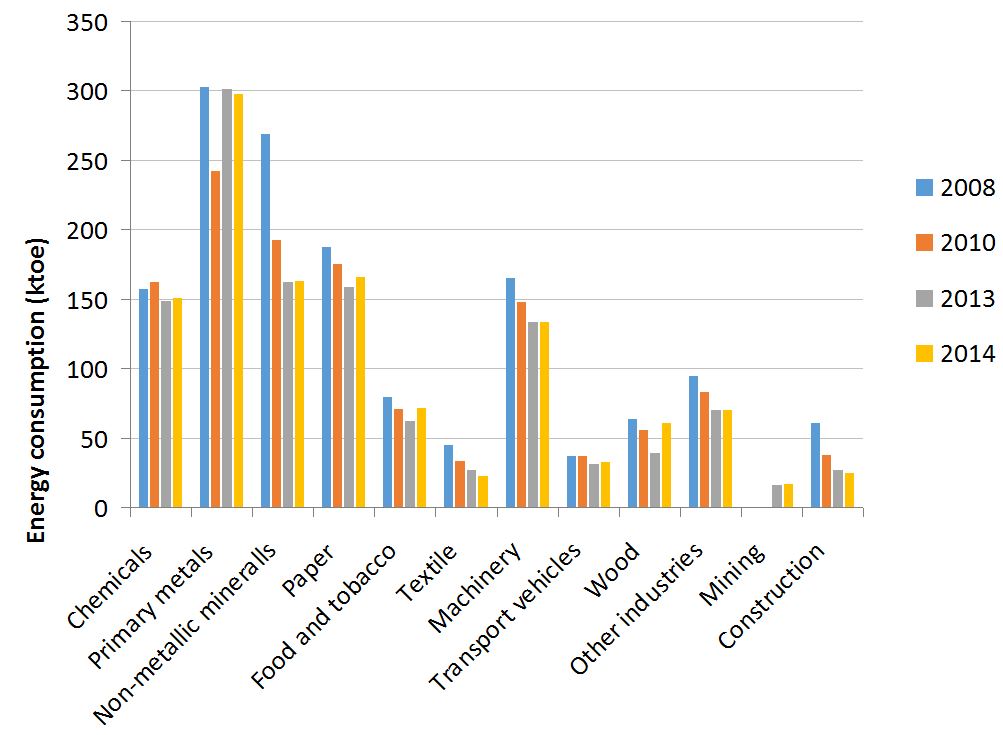
| Chemicals | [ktoe] | 157.3 | 162.3 | 148.2 | 150.4 |
| Primary metals | [ktoe] | 302.5 | 241.8 | 301.1 | 297.8 |
| Non-metallic mineralls | [ktoe] | 268.5 | 192.3 | 162 | 162.9 |
| Paper | [ktoe] | 187.3 | 174.7 | 158.6 | 165.5 |
| Food and tobacco | [ktoe] | 78.9 | 70.8 | 62 | 71.3 |
| Textile | [ktoe] | 44.8 | 32.9 | 26.5 | 22.2 |
| Machinery | [ktoe] | 164.8 | 148 | 133.6 | 133 |
| Transport vehicles | [ktoe] | 37 | 36.8 | 31.2 | 32.5 |
| Wood | [ktoe] | 63.3 | 55.6 | 39.1 | 60.7 |
| Other industries | [ktoe] | 94.1 | 83 | 69.8 | 69.9 |
| Mining | [ktoe] | 0 | 0 | 15.8 | 16.8 |
| Construction | [ktoe] | 60.2 | 37.3 | 26.6 | 24.5 |
Jožef Stefan Institute, 2015
| 2008 | 2009 | 2010 | 2012 | 2012 | 2012 | 2012 | ||
|---|---|---|---|---|---|---|---|---|
| Chemicals | 2008=100 | 100 | 106 | 100 | 91 | 87 | 81 | 81 |
| Steel | 2008=100 | 100 | 118 | 107 | 97 | 104 | 105 | 103 |
| Non ferrous metals | 2008=100 | 100 | 98 | 79 | 104 | 113 | 112 | 105 |
| Non-metallic mineralls | 2008=100 | 100 | 93 | 100 | 100 | 95 | 100 | 96 |
| Paper | 2008=100 | 100 | 99 | 92 | 90 | 89 | 87 | 86 |
| Machinery | 2008=100 | 100 | 98 | 106 | 95 | 92 | 91 | 86 |
| Total industry | 2008=100 | 100 | 103 | 98 | 95 | 94 | 94 | 94 |
| Food and tobacco | 2008=100 | 100 | 115 | 96 | 87 | 85 | 85 | 98 |
| Textile | 2008=100 | 100 | 123 | 128 | 108 | 104 | 110 | 93 |
| Transport vehicles | 2008=100 | 100 | 104 | 98 | 97 | 112 | 110 | 100 |
| Wood | 2008=100 | 100 | 108 | 110 | 96 | 86 | 100 | 166 |
| Other industries | 2008=100 | 100 | 101 | 100 | 91 | 82 | 84 | 83 |
| Mining | 2008=100 | 100 | 113 | 84 | 85 | 87 | 89 | 80 |
| Construction | 2008=100 | 100 | 93 | 87 | 82 | 98 | 82 | 69 |
Goals
An increase in the efficiency of energy use and activities in the transport sector must result in energy use in transport such that the achievement of the following goals is enabled:
- 9% reduction of final energy consumption by 2016;
- an increase in emissions from sources not included in the EU-EU-ETS by no more than 4% by 2020
- 25% share of renewable energy sources in gross final energy consumption by 2020
- 20% improvement of energy efficiency by 2020 – this goal was formulated in the Energy Efficiency Directive (2012/27/EU) as target energy consumption at the EU level. Member States had to define their own goals that would contribute to the achievement of the goal at the EU level. Slovenia's goals for 2020 are as follows: energy supply below or equal to 7,125 ktoe and final energy consumption below or equal to 5,118 ktoe (Energy Efficiency Action Plan for the period 2014–2020).
Based on the Energy Efficiency Action Plan for the period 2014–2020, final energy consumption in 2020 must not exceed:
- 2,201 ktoe in transport
- 1,041 ktoe in households
- 1,307 in industry
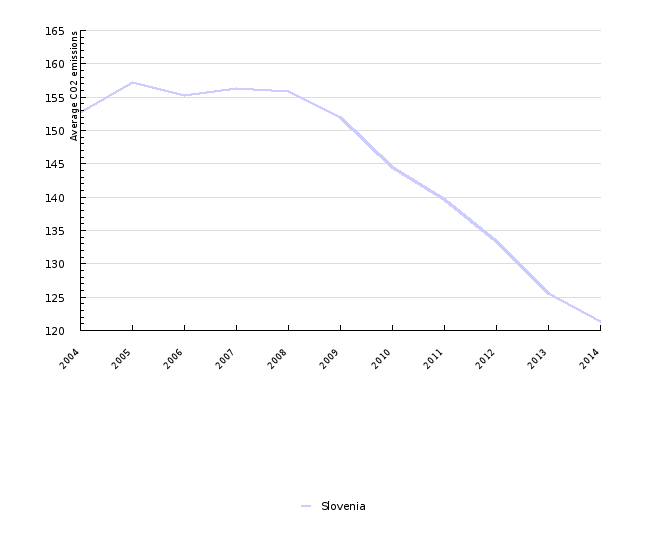
In 2015, the average emissions of new cars should not have exceeded 130 gCO2/km, while in 2020, they may not exceed 95 gCO2/km.
Comment
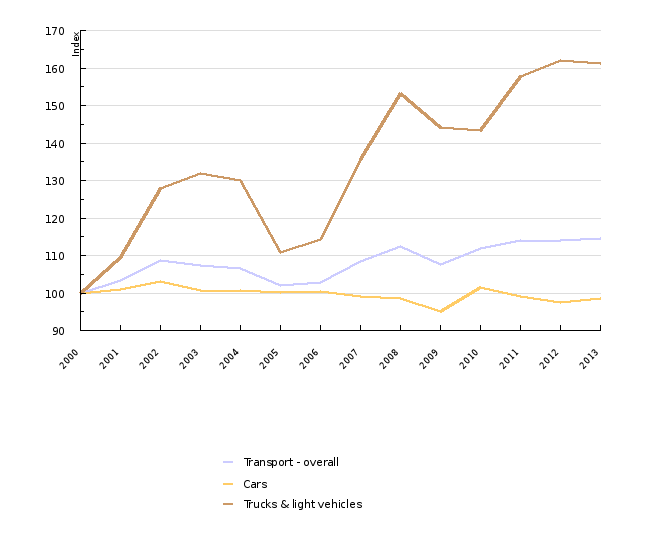
Within the transport sector, by far the highest share of energy is consumed in road transport. In 2013, the share of road transport was 97%, which was two percentage points more than in 2000. In 2013, 62% of energy consumption in road transport was attributed to cars and 34% to cargo vehicles. Buses represented 1% and motorcycles 0.4%. Compared to 2000, the energy consumption of cargo vehicles increased significantly, by 161%. Energy consumption of cars increased by 28%, consumption of buses decreased by 31% and consumption of motorcycles increased by 349%. The overall energy consumption in road traffic increased by 54%, while in the last year, a 3% decrease of energy consumption was recorded. The growth of consumption in freight transport can be divided into several periods. In the period 2000–2003, before Slovenia entered the EU, average annual growth was 11.5%, while in the period 2003–2008, it was 15.7%. As a result of the economic crisis, energy consumption in freight transport decreased in 2009. After 2009, consumption increased until 2012 when it was still 5% below the value from 2008. In 2013, consumption decreased by 3%. Similar trends were observed in energy consumption of cars.
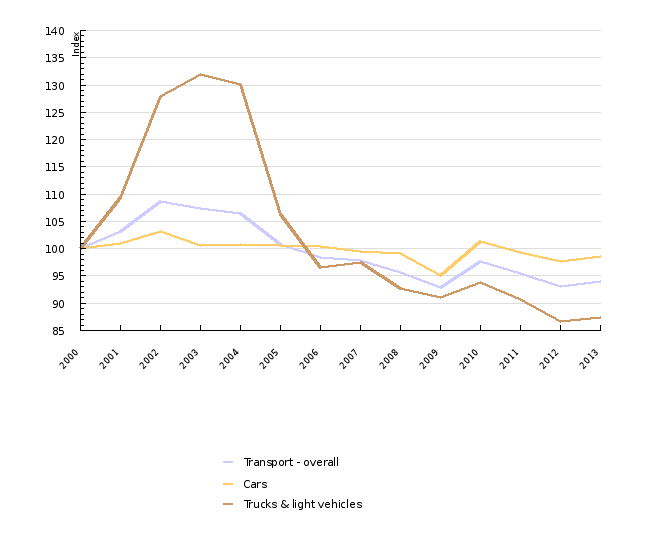
In the period 2000–2013, the efficiency of energy use in transport in Slovenia, estimated on the basis of the quantity of fuels sold on the territory of Slovenia, dropped by 15%. The drop is a consequence of decreased efficiency of freight transport, where energy consumption per tonne kilometre in 2013 was 61% higher than in 2000. Efficiency of cars was slightly higher (2%) than in 2000. In other transport modes, it improved considerably, but due to their low shares in total energy consumption, it had no significant influence on the total efficiency in transport. The decreased efficiency of freight transport can be attributed to the fact that the statistics follow the sale of fuels in Slovenia instead of fuel consumption of Slovenian cargo vehicles, which causes disparities between the data on energy consumption of cargo vehicles because it includes the sale of fuels to foreign vehicles (transit), as well as the data on performed tonne kilometres, where only Slovenian vehicles are included.
The sale of fuels for transit transport needs to be excluded from the energy consumption balance in order to make a realistic estimate of the improvement of energy use efficiency in transport. As no exact data on the quantity of fuels sold to foreign vehicles is available, estimates are required. In 2013, energy consumption in the amount of 13.0 PJ was attributed to transit transport, which represented 17% of total energy consumption in transport. Cargo vehicles are the highest energy consumers (92%), with the rest being consumed by cars. With transit transport excluded from energy consumption, efficiency of energy use in transport in the period 2000–2013 improves by more than 6%, while efficiency of freight transport improves by 13%. The estimate of energy consumption by transit transport is very rough. Accordingly, calculations for the years before 2005 are very approximate.
Considering the high share cars have in energy consumption and consequently in CO2 emissions, improvements in car efficiency significantly affect both. Therefore, within its strategy to improve the fuel efficiency of cars, the EU adopted a regulation (443/2009) setting emission performance standards for new passenger cars. The Regulation stipulates that average CO2 emissions from new cars may not exceed 130 gCO2/km in 2015, while a longer-term goal for 2020 is set at 95 gCO2/km. The average for new cars in Slovenia was 121 gCO2/km in 2013, which was considerably below the target. Compared to the preceding year, emissions were reduced by 3%, while compared to 2008 they were reduced by 22%. In addition to the improvements of existing technologies (cars with fossil-fuel powered internal combustion engines), introduction of new technologies contributes to lower average emissions of CO2 per kilometre. The share of hybrid vehicles in the number of newly purchased passenger cars was 0.2% in 2012, while the share of electric vehicles was 0.04%. It must be pointed out, though, that the above data presents emissions determined under laboratory conditions, while actual emissions decrease at a slower rate. In 2014, actual emissions exceeded those measured under laboratory conditions by almost 40% (ICCT, 2015).
In households, most energy is used for residential heating. Over an average winter, energy consumption for heating in 2014 amounted to 36.0 PJ, which represented 68% of energy consumption in households. Compared to 2009, energy consumption for heating decreased by14%, while the share of heating in household energy consumption decreased by 3 percentage points. The share of heating was followed by the share of hot water, which represented 14% of household energy consumption, and large household appliances that include refrigerators (also combined), freezers, washing and drying machines, dishwashers and TVs. In 2014, their share was 5.6%, while compared to 2009 it increased by 0.5 percentage points. 4.5% of energy was used for cooking and slightly less than 2% for lighting. The remaining energy (5.8% in 2014 and 5.1% in 2009) was used for small appliances, residential cooling, running of pumps in central heating and other purposes.
Energy consumption in households is decreasing, which is a consequence of the implementation of energy efficiency measures. On the other hand, the decrease in energy consumption is slowed by population growth (1.6% in the period 2009–2014), the increase in heating areas (4,8%) and the increase in the number of electrical appliances (the number of large appliances increased by 9.6%). The efficiency of energy use in households improved by 14%, while average-winter energy consumption decreased by 10%. The greatest contribution to overall efficiency improvements in households was the improvement in heating efficiency (18%), which is a consequence of energy refurbishment of buildings and replacement of heating systems. Lighting efficiency improved considerably as well (by 11.5%). Overall efficiency of large household appliances improved by 7%. The greatest improvement was recorded in washing machines (13%) and refrigerators (10%), while efficiency of TVs dropped by 7%, which is largely a consequence of their larger screen sizes. Efficiency of hot water generation slightly improved, while cooking efficiency decreased by 6%.
In industry in Slovenia, most energy is consumed in metal manufacturing. In 2012, its share in total energy consumption in industry was 25%. The sector can be further divided into manufacture of steel and manufacture of non-ferrous metals. Each of the two consumes half of the energy within the sector. In energy consumption in 2012, manufacture of non-metal mineral products (cement, lime, etc.) and the paper industry (14% each in total energy consumption in industry) were significant energy consumers as well. The chemical industry and manufacture of machines and equipment had a 12% share each in energy consumption in industry. The above-mentioned sectors combined represented 77% of energy consumption in industry in 2012. Other sectors include the food processing industry, the textile industry, manufacture of transport equipment, the wood processing industry, other industry, extraction of ores and minerals and construction.
In the period 2008–2014, the efficiency of energy use in industry improved, which means that energy consumption per unit of industrial production was reduced. However, the trend was very unstable. In 2009, efficiency decreased, which can be attributed to reduced industrial production due to the economic crisis. Since 2009 onwards, efficiency has been improving due to slow economic recovery and growing industrial production, structural changes and investments in the improvement of efficiency of processes. In 2014, intensity of energy use in industry was 6% higher than in 2008. Since 2011, the increase in intensity has been very slow.
The analysis of intensity of energy use in main industry sectors shows very diverse trends. The most varied trend can be seen in the manufacture of steel and of non-ferrous metals. In the manufacture of metals, intensity increased greatly in 2009 as a consequence of reduced steel production due to the economic crisis. In the years that followed, intensity decreased as the economy was recovering, while in 2012 and 2013 it increased again with steel manufacture remaining at almost the same level as in the preceding year, meaning that restructuring probably occurred. The trend in non-ferrous metals was completely the opposite (compared to steel manufacture) during the economic crisis, which was a consequence of reduced production of primary aluminium, an extremely energy intensive process. With the increase in production in 2011, the intensity of manufacture of non-ferrous metals increased and the trend continued into 2012. Over the last two years, the intensity decreased, probably due to the increase in the manufacture of secondary aluminium. Intensity of energy use in the manufacture of non-metal mineral products is greatly affected by the crisis in the construction sector. Cement production hit its low point in 2011, which coincided with the maximum intensity of energy use in this sector. In the chemical industry, intensity trends closely followed the course of the economic crisis, while in the manufacture of machines and equipment, the only increase in intensity was observed in 2010, which was a consequence of structural factors, while in other years intensity was below the 2008 level.
The measures for the improvement of energy efficiency for all sectors analysed above and the measures for the reduction of emissions are included in the Third national energy efficiency action plan and the Operational programme to reduce greenhouse gas emissions by 2020.


