[OD06] Direct Material Input and Domestic Material Consumption

Key message

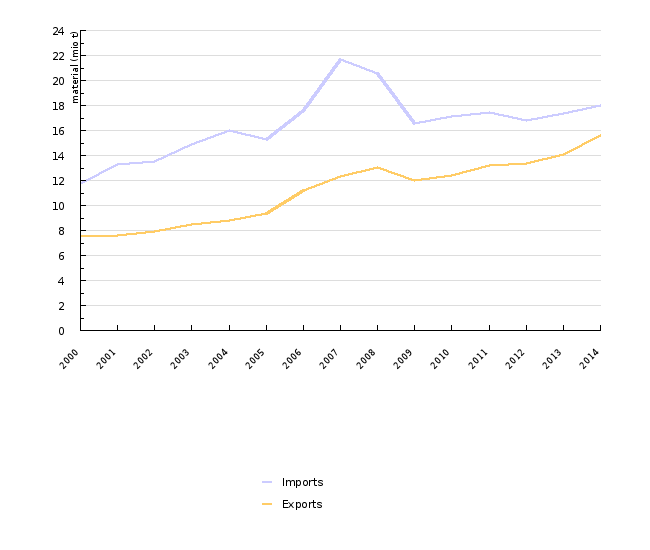
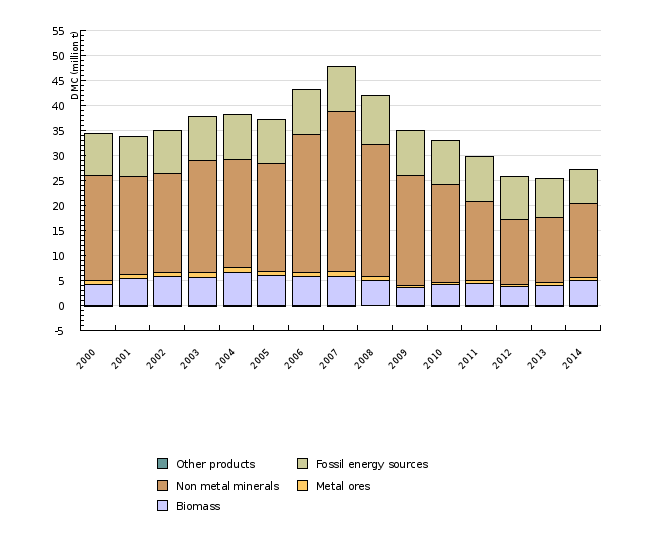
The exploitation of natural resources produced or extracted in Slovenia showed an upward trend until 2007, when it began to decline. In 2014 it increased again (27 million tonnes). Looking at domestic extraction (24.6 million tonnes in total), compared to 2013, the use of biomass increased by 17% and mineral resources by 26%, whereas extraction of fossil fuels decreased by 20%. Compared to 2013, imports and exports increased by 4 and 11 per cent, respectively.
Definition
This indicator shows domestic material consumption and direct material input, the structure of domestic material consumption and international comparison of material consumption per capita.
Domestic material consumption (DMC) is used to measure the total mass of all solid, liquid and gaseous materials (with the exception of water and air that are not directly contained in materials) obtained from natural resources (domestic natural resources + import and export) that enter production and consumption processes in a certain country within a year. Direct material flows are divided into six main groups: biomass (from agriculture, forestry, fishing, hunting and gathering), metallic and non-metallic mineral resources, fossil energy sources, waste and other.
Direct material input (DMI) is used to measure direct input of materials to be used in an economy, i.e. all materials that have economic value and are used in manufacturing activities and consumption; DMI includes materials obtained (and used) within a certain country and the total import of materials.
Charts
SI-STAT, Statistical Office of the Republic of Slovenia, 2016
| 2000 | 2001 | 2002 | 2003 | 2004 | 2005 | 2006 | 2007 | 2008 | 2009 | ||
|---|---|---|---|---|---|---|---|---|---|---|---|
| Imports | mio t | 11.788 | 13.306 | 13.55 | 14.917 | 16 | 15.264 | 17.626 | 21.685 | 20.565 | 16.546 |
| Exports | mio t | 7.609 | 7.629 | 7.943 | 8.51 | 8.783 | 9.387 | 11.236 | 12.318 | 13.018 | 12.007 |
| 2010 | 2011 | 2012 | 2013 | 2014 | |||||||
| Imports | mio t | 17.096 | 17.43 | 16.802 | 17.372 | 18.034 | |||||
| Exports | mio t | 12.392 | 13.161 | 13.341 | 14.075 | 15.63 |
SI-STAT, Statistical Office of the Republic of Slovenia, 2016
| 2000 | 2001 | 2002 | 2003 | 2004 | 2005 | 2006 | 2007 | 2008 | 2009 | ||
|---|---|---|---|---|---|---|---|---|---|---|---|
| Domestic material consumption | million t | 34.18 | 33.598 | 34.86 | 37.711 | 38.133 | 37.029 | 43.126 | 47.744 | 42.023 | 34.723 |
| Biomass | million t | 4.27 | 5.441 | 5.871 | 5.693 | 6.655 | 6.079 | 5.734 | 5.835 | 5.045 | 3.673 |
| Metal ores | million t | 0.675 | 0.699 | 0.716 | 0.856 | 0.902 | 0.729 | 0.905 | 0.927 | 0.835 | 0.34 |
| Non metal minerals | million t | 21.082 | 19.627 | 19.841 | 22.435 | 21.584 | 21.566 | 27.648 | 32.128 | 26.36 | 22.032 |
| Fossil energy sources | million t | 8.301 | 7.987 | 8.612 | 8.882 | 9.119 | 8.769 | 8.989 | 8.981 | 9.84 | 8.865 |
| Other products | million t | -0.148 | -0.157 | -0.172 | -0.143 | -0.12 | -0.113 | -0.151 | -0.128 | -0.056 | -0.187 |
| 2010 | 2011 | 2012 | 2013 | 2014 | |||||||
| Domestic material consumption | million t | 32.822 | 29.565 | 25.614 | 25.118 | 26.989 | |||||
| Biomass | million t | 4.196 | 4.471 | 3.739 | 4.031 | 4.901 | |||||
| Metal ores | million t | 0.501 | 0.608 | 0.475 | 0.537 | 0.613 | |||||
| Non metal minerals | million t | 19.457 | 15.658 | 12.925 | 12.962 | 14.856 | |||||
| Fossil energy sources | million t | 8.843 | 8.992 | 8.654 | 7.788 | 6.847 | |||||
| Other products | million t | -0.173 | -0.163 | -0.177 | -0.197 | -0.222 |
EEA report More From Less – material resource efficiency in Europe, Country profile, 2015
| 2000 | 2007 | 2014 | ||
|---|---|---|---|---|
| Italy | tonnes per capita | 16.65 | 14.177 | 8.278 |
| Spain | tonnes per capita | 17.135 | 20.601 | 8.322 |
| United Kingdom | tonnes per capita | 12.542 | 11.722 | 8.714 |
| Croatia | tonnes per capita | 7.51 | 13.587 | 9.314 |
| Netherlands | tonnes per capita | 12.732 | 12.196 | 10.28 |
| Hungary | tonnes per capita | 12.044 | 12.133 | 11.821 |
| France | tonnes per capita | 14.55 | 14.282 | 11.96 |
| Malta | tonnes per capita | 9.527 | 8.736 | 12.287 |
| Cyprus | tonnes per capita | 24.314 | 27.313 | 12.337 |
| Greece | tonnes per capita | 14.189 | 22.178 | 12.353 |
| Slovakia | tonnes per capita | 10.072 | 13.399 | 12.562 |
| EU-28 | tonnes per capita | 15.485 | 16.575 | 13.079 |
| Slovenia | tonnes per capita | 17.185 | 23.658 | 13.089 |
| Belgium | tonnes per capita | 14.928 | 16.901 | 14.252 |
| Portugal | tonnes per capita | 19.48 | 21.185 | 14.298 |
| Serbia | tonnes per capita | 14.514 | 14.455 | |
| Lithuania | tonnes per capita | 8.336 | 15.082 | 14.835 |
| Czech Republic | tonnes per capita | 17.853 | 19.095 | 15.18 |
| Germany | tonnes per capita | 17.695 | 16.268 | 16.109 |
| Poland | tonnes per capita | 14.094 | 13.491 | 17.215 |
| Bulgaria | tonnes per capita | 12.353 | 18.834 | 19.448 |
| Denmark | tonnes per capita | 23.576 | 26.475 | 20.086 |
| Latvia | tonnes per capita | 14.643 | 22.382 | 20.467 |
| Luxembourg | tonnes per capita | 25.575 | 26.551 | 20.591 |
| Austria | tonnes per capita | 23.098 | 24.975 | 21.034 |
| Romania | tonnes per capita | 7.684 | 20.557 | 21.327 |
| Ireland | tonnes per capita | 34.177 | 41.544 | 21.537 |
| Sweden | tonnes per capita | 20.179 | 22.515 | 23.055 |
| Norway | tonnes per capita | 25.331 | 28.179 | |
| Estonia | tonnes per capita | 12.445 | 29.013 | 29.324 |
| Finland | tonnes per capita | 33.73 | 38.75 | 31.074 |
| Switzerland | tonnes per capita | 12.534 | 12.304 | |
| Turkey | tonnes per capita | 9.537 | 11.558 | |
| Iceland | tonnes per capita |
Goals
- To decouple economic growth from resource use, increase competitiveness and improve reliability of supply;
- To improve economy efficiency while reducing pressures on the environment.
Comment
Our economy and well-being are highly reliant on natural resources that are imported or obtained at home. The use of natural resources, whether renewable (e.g. biomass) or non-renewable (such as fossil fuels and mineral resources) has been indispensible for our economic activities for centuries. However, certain resources have become extremely rare or are only available in certain geographic regions, which is why they are subject to various speculations at the global level. In addition, the use of natural resources is closely connected with various pressures on the environment, including waste generation.
After 2000, when the monitoring of direct input and domestic consumption of materials was initiated in Slovenia, consumption peaked in 2007, after which it declined until 2013. In 2014, it increased again (by 7% compared to 2013).
In 2014, Slovenia produced and imported a total of 42.6 million tonnes of various materials. Almost half of these materials are mineral materials obtained in Slovenia, mostly technical stone, gravel and sand that are used for construction. The quantity of raw materials for construction obtained in Slovenia, which had been increasing up to 2007 (amounting to 23.6 million tonnes) and contributed significantly to the increase of material consumption per capita (DMC per capita), began declining after 2007. In 2014, consumption of materials per capita amounted to approximately 13 million tonnes. However, the total mass of materials and imported products still represents about a third (33% in 2014) of materials consumed in Slovenia in a year. In 2014, Slovenia exported 18 million tonnes of raw or processed materials.
The share of renewable materials (agricultural products, catch and wood biomass) obtained within Slovenia represents approximately 28% of the total mass of materials.
Exploitation of natural resources produced or extracted within Slovenia increased until 2007, after which it decreased until 2013. In 2014, when a slightly increase was recorded, 24.6 million tonnes of natural resources were utilised. Compared to the preceding year, the quantity of utilised biomass increased (a 26% increase from 2013). The quantity of utilised fossil energy resources decreased (a 20% decrease from 2013) in the same year.
The import of materials increased until 2008 (from 11.7 million tonnes in 2000 to 20.6 million tonnes in 2008), after which it started decreasing and increased again slightly in 2014 (18 million tonnes), while the export of materials from Slovenia gradually increased. In 2000, 7.6 million tonnes of raw or processed materials were exported, while in 2014 the export amounted to 15.6 million tonnes. In 2014, the import of materials exceeded their export by 2.4 million tonnes.
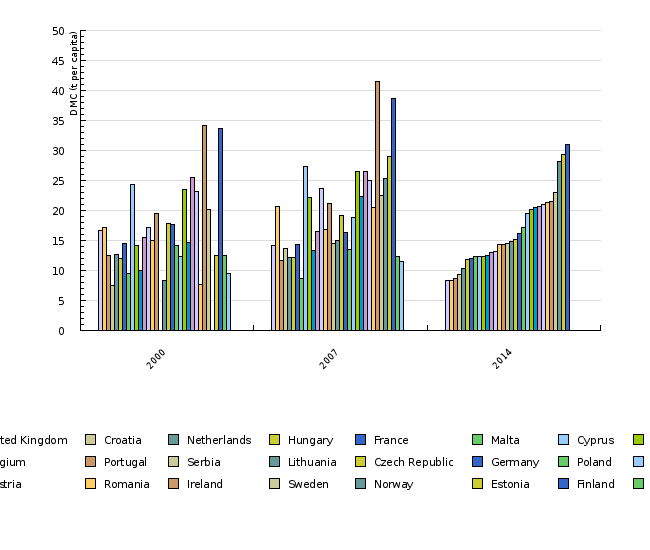
Direct material input per capita varies widely between EU countries as well as globally. In 2014, the highest material input per capita (approximately 30 million tonnes) was recorded in Finland and Estonia. The lowest input (approximately 8 million tonnes per capita) was recorded in Italy, United Kingdom and Spain. The EU average for 2014 amounted to 13 million tonnes per capita. Slovenia ranks at the average of EU countries. In 2014, 13.09 million tonnes of materials per capita were consumed in Slovenia.
Although the indicator ‘domestic material consumption’ presents a good picture of the consumption of materials, it fails to give a clear picture of the impact of the consumption of various types of materials on the environment. Therefore, which material consumption indicators (DMI, DMC, RME [Raw Material Equivalents], TMR [Total material Requirements], TMC, etc.) are the most appropriate for international comparison and for measuring the exploitation of natural resources, and the resulting impacts on the environment, is still being debated at various levels.


