[PO01] Annual GHG emissions according to Regulation (EU) 2023/857

Key message

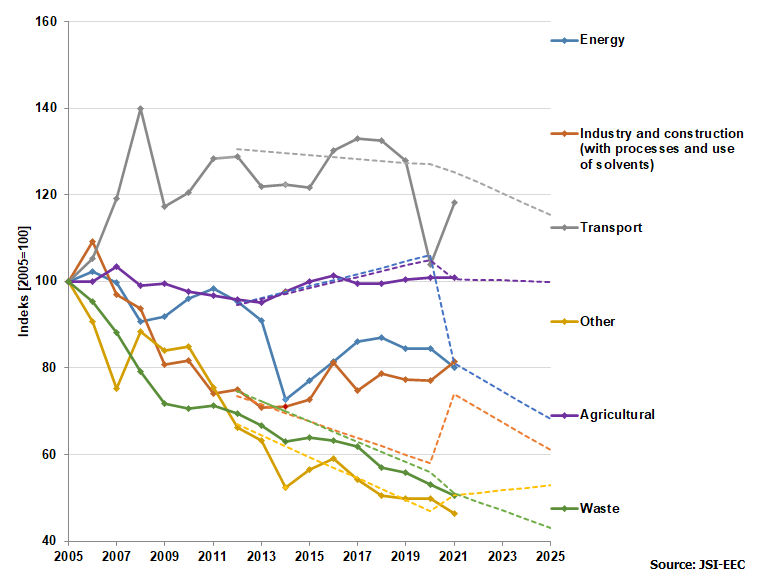
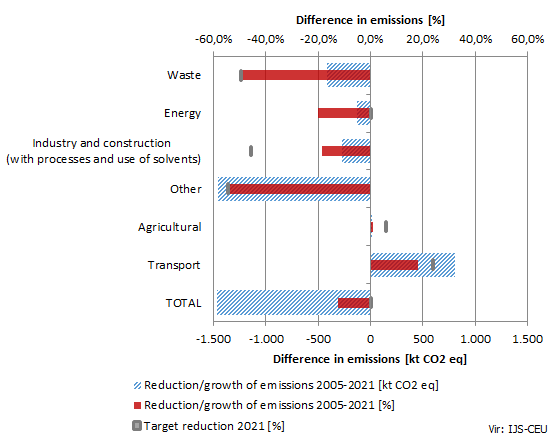
In 2021, greenhouse gas (GHG) emissions from sources according to the Regulation (EU) 2023/857 increased by 5.5% compared to the previous year and were lower than the annual target by 8.6%, which means that the target was achieved. GHG emissions decreased in the waste and electricity and heat production sectors, and the most in the consumer sector. In all other sectors emissions increased, with the exception of the agriculture, where they remained at the 2020 level. Despite good results, additional measures are needed to ensure long-term GHG emissions reduction in accordance with the mid- and long-term targets.
Charts
Jožef Stefan Institute - Energy Efficiency Centre
| Total GHG emmissions in nonETS sector | Target value set in Decision 406/2009/ES | Target value set in Regulation (EU) 2023/857 | |
|---|---|---|---|
| 2005 | 100 | ||
| 2006 | 100.78 | ||
| 2007 | 100.65 | ||
| 2008 | 109.23 | ||
| 2009 | 97.82 | ||
| 2010 | 99.20 | ||
| 2011 | 99.02 | ||
| 2012 | 96.73 | ||
| 2013 | 92.46 | 103.66 | |
| 2014 | 89.25 | 103.91 | |
| 2015 | 90.87 | 104.16 | |
| 2016 | 96.05 | 104.42 | |
| 2017 | 95.05 | 102.65 | |
| 2018 | 94.18 | 102.94 | |
| 2019 | 92.11 | 103.23 | |
| 2020 | 83.09 | 103.52 | |
| 2021 | 87.68 | 95.92 | |
| 2022 | 93.43 | ||
| 2023 | 90.94 | ||
| 2024 | 88.45 | ||
| 2025 | 85.96 |
Jožef Stefan Institute - Energy Efficiency Centre
| Transport[%] | Agricultural[%] | Other[%] | Waste[%] | Energy[%] | Industry and construction (with processes and use of solvents)[%] | |
|---|---|---|---|---|---|---|
| 2021 | 0.50 | 0.17 | 0.12 | 0.04 | 0.05 | 0.12 |
Jožef Stefan Institute - Energy Efficiency Centre
| Transport[kt CO2 eq] | Other[kt CO2 eq] | Agricultural[kt CO2 eq] | Waste[kt CO2 eq] | Energy[kt CO2 eq] | Industry and construction (with processes and use of solvents)[kt CO2 eq] | |
|---|---|---|---|---|---|---|
| 2005 | 4401.34 | 2719.31 | 1798.72 | 849.29 | 635.36 | 1487.13 |
| 2006 | 4637.35 | 2463.87 | 1797.91 | 809.62 | 649.18 | 1625.19 |
| 2007 | 5239.95 | 2045.94 | 1858.87 | 749.26 | 633.16 | 1440.42 |
| 2008 | 6159.08 | 2402.58 | 1781.53 | 673.05 | 577.01 | 1394.63 |
| 2009 | 5158.76 | 2286.80 | 1790.46 | 610.19 | 583.21 | 1201.59 |
| 2010 | 5299.22 | 2312.36 | 1758.27 | 599.13 | 609.92 | 1216.01 |
| 2011 | 5649.48 | 2052.16 | 1740.59 | 605.56 | 624.40 | 1102.58 |
| 2012 | 5668.06 | 1799.57 | 1724.56 | 589.02 | 605.14 | 1115.09 |
| 2013 | 5367.27 | 1718.12 | 1709.18 | 566.93 | 577.69 | 1054.36 |
| 2014 | 5383.26 | 1421.33 | 1755.99 | 534.13 | 462.06 | 1055.57 |
| 2015 | 5353.65 | 1537.63 | 1799.50 | 542.49 | 490.37 | 1080.82 |
| 2016 | 5726.82 | 1607.22 | 1822.16 | 537.76 | 518.00 | 1209.02 |
| 2017 | 5856.28 | 1475.43 | 1787.83 | 524.21 | 546.52 | 1111.88 |
| 2018 | 5835.01 | 1371.04 | 1787.57 | 483.65 | 552.49 | 1169.03 |
| 2019 | 5625.00 | 1357.73 | 1807.84 | 474.04 | 536.78 | 1151.02 |
| 2020 | 4575.49 | 1357.61 | 1812.53 | 451.12 | 536.03 | 1146.90 |
| 2021 | 5205.46 | 1258.02 | 1812.99 | 428.77 | 508.32 | 1210.29 |
Jožef Stefan Institute - Energy Efficiency Centre
| Transport | Other | Agricultural | Waste | Energy | Industry and construction (with processes and use of solvents) | |||||||
|---|---|---|---|---|---|---|---|---|---|---|---|---|
| 2005 | 100 | 100 | 100 | 100 | 100 | 100 | ||||||
| 2006 | 105.36 | 90.61 | 99.96 | 95.33 | 102.18 | 109.28 | ||||||
| 2007 | 119.05 | 75.24 | 103.34 | 88.22 | 99.65 | 96.86 | ||||||
| 2008 | 139.94 | 88.35 | 99.04 | 79.25 | 90.82 | 93.78 | ||||||
| 2009 | 117.21 | 84.10 | 99.54 | 71.85 | 91.79 | 80.80 | ||||||
| 2010 | 120.40 | 85.03 | 97.75 | 70.54 | 96.00 | 81.77 | ||||||
| 2011 | 128.36 | 75.47 | 96.77 | 71.30 | 98.28 | 74.14 | ||||||
| 2012 | 128.78 | 130.54 | 66.18 | 66.96 | 95.88 | 94.52 | 69.35 | 74.58 | 95.24 | 94.72 | 74.98 | 73.50 |
| 2013 | 121.95 | 130.09 | 63.18 | 64.47 | 95.02 | 95.83 | 66.75 | 72.26 | 90.92 | 96.13 | 70.90 | 71.56 |
| 2014 | 122.31 | 129.65 | 52.27 | 61.97 | 97.62 | 97.14 | 62.89 | 69.94 | 72.72 | 97.54 | 70.98 | 69.63 |
| 2015 | 121.64 | 129.21 | 56.55 | 59.48 | 100.04 | 98.45 | 63.88 | 67.62 | 77.18 | 98.95 | 72.68 | 67.69 |
| 2016 | 130.12 | 128.77 | 59.10 | 56.98 | 101.30 | 99.76 | 63.32 | 65.29 | 81.53 | 100.36 | 81.30 | 65.75 |
| 2017 | 133.06 | 128.33 | 54.26 | 54.49 | 99.40 | 101.07 | 61.72 | 62.97 | 86.02 | 101.77 | 74.77 | 63.81 |
| 2018 | 132.57 | 127.88 | 50.42 | 51.99 | 99.38 | 102.38 | 56.95 | 60.65 | 86.96 | 103.18 | 78.61 | 61.88 |
| 2019 | 127.80 | 127.44 | 49.93 | 49.50 | 100.51 | 103.69 | 55.82 | 58.32 | 84.49 | 104.59 | 77.40 | 59.94 |
| 2020 | 103.96 | 127 | 49.92 | 47 | 100.77 | 105 | 53.12 | 56 | 84.37 | 106 | 77.12 | 58 |
| 2021 | 118.27 | 125.32 | 46.26 | 50.53 | 100.79 | 100.59 | 50.49 | 51.11 | 80.01 | 81.13 | 81.38 | 73.91 |
| 2022 | 122.84 | 51.14 | 100.41 | 49.09 | 77.89 | 70.70 | ||||||
| 2023 | 120.36 | 51.75 | 100.24 | 47.08 | 74.66 | 67.49 | ||||||
| 2024 | 117.88 | 52.35 | 100.06 | 45.07 | 71.42 | 64.27 | ||||||
| 2025 | 115.40 | 52.96 | 99.88 | 43.06 | 68.18 | 61.06 |
Jožef Stefan Institute - Energy Efficiency Centre
Methodology
The indicator methodology is available only in Slovene (link to the indicator)


