[PO01] Annual GHG emissions according to Decision No. 406/2009/ES

Key message

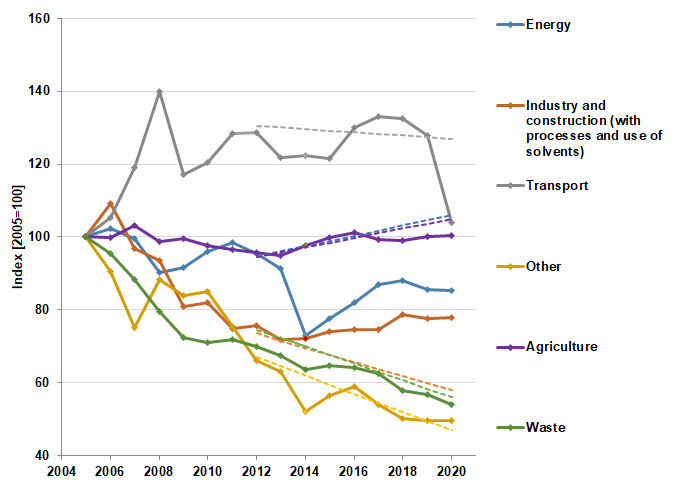
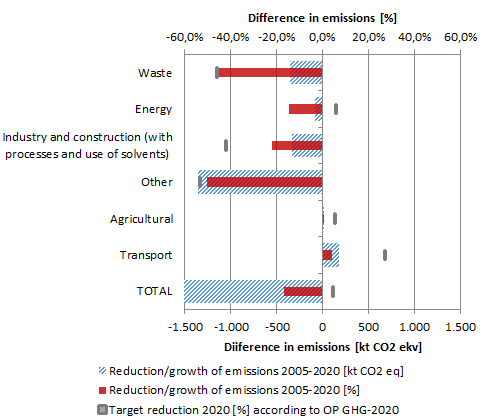
In 2020 Slovenia's non-ETS greenhouse gas emissions reduced by 9,8% and were 20,7% below the 2020 target, which means the target was achieved. The large reduction in emissions in 2020 was mainly due to reduced transport activity due to the coronavirus pandemic. GHG emissions decreased in the waste, electricity and heat sector and most in the transport sector. In all other sectors, emissions recorded low growth
Despite the good results, additional measures are needed for long-term GHG emissions reduction in line with the mid- and long-term targets.
Charts
Jožef Stefan Institute - Energy Efficiency Centre
| Total GHG emmissions in nonETS sector | Target value set in Decision 406/2009/ES | |
|---|---|---|
| 2005 | 100 | |
| 2006 | 100.88 | |
| 2007 | 100.72 | |
| 2008 | 109.46 | |
| 2009 | 97.97 | |
| 2010 | 99.41 | |
| 2011 | 99.29 | |
| 2012 | 97.03 | |
| 2013 | 92.75 | 105.26 |
| 2014 | 89.64 | 105.52 |
| 2015 | 91.24 | 105.77 |
| 2016 | 95.47 | 106.03 |
| 2017 | 95.29 | 104.23 |
| 2018 | 94.48 | 104.53 |
| 2019 | 92.41 | 104.83 |
| 2020 | 83.32 | 105.12 |
Jožef Stefan Institute - Energy Efficiency Centre
| Transport[%] | Agricultural[%] | Other[%] | Waste[%] | Energy[%] | Industry and construction (with processes and use of solvents)[%] | |
|---|---|---|---|---|---|---|
| 2020 | 0.47 | 0.18 | 0.14 | 0.12 | 0.05 | 0.04 |
Jožef Stefan Institute - Energy Efficiency Centre
| Transport[kt CO2 ekv] | Other[kt CO2 ekv] | Agricultural[kt CO2 ekv] | Waste[kt CO2 ekv] | Energy[kt CO2 ekv] | Industry and construction (with processes and use of solvents)[kt CO2 ekv] | |
|---|---|---|---|---|---|---|
| 2005 | 4405.91 | 2704.53 | 1716.96 | 766.46 | 594.84 | 1521.56 |
| 2006 | 4642.09 | 2451.41 | 1716.53 | 731.09 | 609.10 | 1662.04 |
| 2007 | 5245.24 | 2030.76 | 1772.53 | 677.40 | 593.08 | 1475.05 |
| 2008 | 6165.07 | 2388.11 | 1695.43 | 609.73 | 537.24 | 1421.74 |
| 2009 | 5162.67 | 2272.68 | 1708.12 | 553.87 | 544.37 | 1230.45 |
| 2010 | 5303.47 | 2298.36 | 1677.63 | 543.92 | 570.93 | 1246.47 |
| 2011 | 5654.28 | 2039.79 | 1659.59 | 549.91 | 585.81 | 1137.22 |
| 2012 | 5673.21 | 1788.57 | 1644.08 | 535.15 | 568.46 | 1152.34 |
| 2013 | 5372.46 | 1705.85 | 1629.58 | 516.55 | 543.75 | 1091.88 |
| 2014 | 5388.84 | 1412.23 | 1676.62 | 487.97 | 434.22 | 1097.03 |
| 2015 | 5359.29 | 1523.86 | 1716.65 | 496.11 | 462.00 | 1126.00 |
| 2016 | 5732.98 | 1592.17 | 1736.97 | 491.59 | 488.15 | 1137.06 |
| 2017 | 5862.78 | 1459.39 | 1702.81 | 480.19 | 516.42 | 1135.77 |
| 2018 | 5841.65 | 1355.69 | 1702.12 | 443.32 | 523.59 | 1196.40 |
| 2019 | 5631.53 | 1343.28 | 1719.63 | 435.16 | 508.32 | 1182.68 |
| 2020 | 4581.05 | 1345.19 | 1723.82 | 414.70 | 507.37 | 1184.02 |
Jožef Stefan Institute - Energy Efficiency Centre
| Transport | Other | Agricultural | Waste | Energy | Industry and construction (with processes and use of solvents) | |||||||
|---|---|---|---|---|---|---|---|---|---|---|---|---|
| 2005 | 100 | 100 | 100 | 100 | 100 | 100 | ||||||
| 2006 | 105.36 | 90.64 | 99.98 | 95.39 | 102.40 | 109.23 | ||||||
| 2007 | 119.05 | 75.09 | 103.24 | 88.38 | 99.70 | 96.94 | ||||||
| 2008 | 139.93 | 88.30 | 98.75 | 79.55 | 90.32 | 93.44 | ||||||
| 2009 | 117.18 | 84.03 | 99.49 | 72.26 | 91.52 | 80.87 | ||||||
| 2010 | 120.37 | 84.98 | 97.71 | 70.97 | 95.98 | 81.92 | ||||||
| 2011 | 128.33 | 75.42 | 96.66 | 71.75 | 98.48 | 74.74 | ||||||
| 2012 | 128.76 | 130.54 | 66.13 | 66.96 | 95.76 | 94.52 | 69.82 | 74.58 | 95.57 | 94.72 | 75.73 | 73.50 |
| 2013 | 121.94 | 130.09 | 63.07 | 64.47 | 94.91 | 95.83 | 67.40 | 72.26 | 91.41 | 96.13 | 71.76 | 71.56 |
| 2014 | 122.31 | 129.65 | 52.22 | 61.97 | 97.65 | 97.14 | 63.67 | 69.94 | 73.00 | 97.54 | 72.10 | 69.63 |
| 2015 | 121.64 | 129.21 | 56.34 | 59.48 | 99.98 | 98.45 | 64.73 | 67.62 | 77.67 | 98.95 | 74.00 | 67.69 |
| 2016 | 130.12 | 128.77 | 58.87 | 56.98 | 101.17 | 99.76 | 64.14 | 65.29 | 82.06 | 100.36 | 74.73 | 65.75 |
| 2017 | 133.07 | 128.33 | 53.96 | 54.49 | 99.18 | 101.07 | 62.65 | 62.97 | 86.82 | 101.77 | 74.65 | 63.81 |
| 2018 | 132.59 | 127.88 | 50.13 | 51.99 | 99.14 | 102.38 | 57.84 | 60.65 | 88.02 | 103.18 | 78.63 | 61.88 |
| 2019 | 127.82 | 127.44 | 49.67 | 49.50 | 100.16 | 103.69 | 56.77 | 58.32 | 85.45 | 104.59 | 77.73 | 59.94 |
| 2020 | 103.98 | 127 | 49.74 | 47 | 100.40 | 105 | 54.11 | 56 | 85.30 | 106 | 77.82 | 58 |
Jožef Stefan Institute - Energy Efficiency Centre
Methodology
The indicator methodology is available only in Slovene (link to the indicator)


