[PO01] Annual GHG emissions according to Regulation (EU) 2018/842

Key message

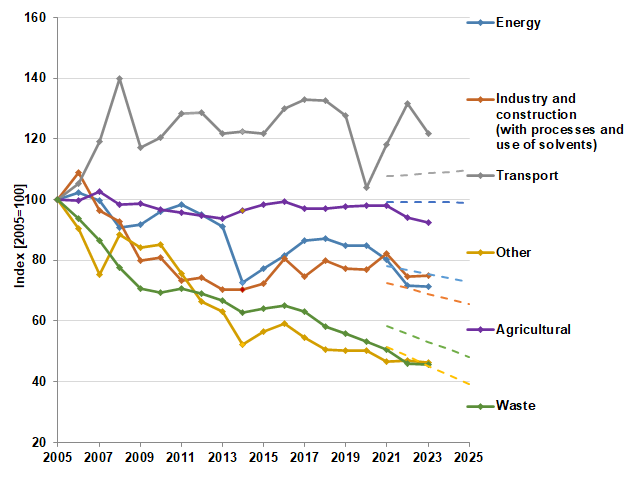
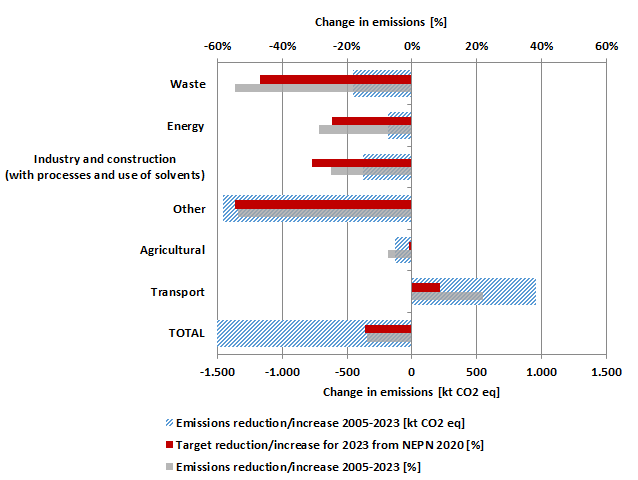
In 2022, greenhouse gas (GHG) emissions from sources according to the Regulation (EU) 2018/842 increased by 3.2% compared to the previous year, but in 2023 they decreased by 4.4% and were 7% below the annual target set by Regulation, thus achieving the indicative annual value. The 2030 target set by the National Energy and Climate Plan from 2020 (NECP 2020) is more ambitious and in 2023 the indicative annual value set by the NECP 2020 was not achieved, lagging behind by 0.5 percentage points. GHG emissions decreased in all sectors in 2023, with the exception of a small increase in the non-ETS industry sector, most notably in the transport sector. Despite current good results, it is for long-term management and reduction of emissions crucial to ensure the implementation of the planned measures to the planned extent.
Charts
Jožef Stefan Institute - Energy Efficiency Centre
| Total GHG emissions in the non-ETS sector[2005=100] | Target values 2021-2030 under Regulation (EU) 2018/842[2005=100] | Indicative annual values from NECP 2020[2005=100] | Target values 2021-2025 under Regulation (EU) 2023/857[2005=100] | Indicative annual values from NECP 2024[2005=100] | |
|---|---|---|---|---|---|
| 2005 | 100 | ||||
| 2006 | 101 | ||||
| 2007 | 100 | ||||
| 2008 | 109 | ||||
| 2009 | 98 | ||||
| 2010 | 99 | ||||
| 2011 | 99 | ||||
| 2012 | 96 | ||||
| 2013 | 92 | ||||
| 2014 | 89 | ||||
| 2015 | 91 | ||||
| 2016 | 96 | ||||
| 2017 | 95 | ||||
| 2018 | 94 | ||||
| 2019 | 92 | ||||
| 2020 | 83 | ||||
| 2021 | 87 | 96 | 96 | ||
| 2022 | 90 | 94 | 87 | 94 | 86 |
| 2023 | 86 | 93 | 86 | 91 | 84 |
| 2024 | 92 | 85 | 89 | 82 | |
| 2025 | 91 | 84 | 86 | 81 | |
| 2026 | 90 | 83 | 79 | ||
| 2027 | 89 | 82 | 77 | ||
| 2028 | 88 | 82 | 75 | ||
| 2029 | 87 | 81 | 74 | ||
| 2030 | 86 | 80 | 72 |
Jožef Stefan Institute - Energy Efficiency Centre
| Transport[%] | Agricultural[%] | Other[%] | Waste[%] | Energy[%] | Industry and construction (with processes and use of solvents)[%] | |
|---|---|---|---|---|---|---|
| 2023 | 0.52 | 0.16 | 0.12 | 0.04 | 0.04 | 0.11 |
Jožef Stefan Institute - Energy Efficiency Centre
| Transport[kt CO2 ekv] | Other[kt CO2 ekv] | Agricultural[kt CO2 ekv] | Waste[kt CO2 ekv] | Energy[kt CO2 ekv] | Industry and construction (with processes and use of solvents)[kt CO2 ekv] | |
|---|---|---|---|---|---|---|
| 2005 | 4401.53 | 2724.16 | 1762.96 | 827.90 | 635.37 | 1506.44 |
| 2006 | 4637.57 | 2467.46 | 1758.99 | 775.63 | 649.20 | 1641.14 |
| 2007 | 5240.23 | 2050.78 | 1810.51 | 716.72 | 633.17 | 1452.11 |
| 2008 | 6159.43 | 2407.16 | 1733.09 | 642.09 | 577.01 | 1397.93 |
| 2009 | 5159.04 | 2290.91 | 1741.96 | 586.20 | 583.21 | 1203.60 |
| 2010 | 5299.52 | 2316.68 | 1705.10 | 574.10 | 609.92 | 1218.76 |
| 2011 | 5649.79 | 2057.64 | 1688.08 | 585.74 | 624.41 | 1106.61 |
| 2012 | 5668.41 | 1805.78 | 1671.27 | 572.84 | 605.15 | 1118.86 |
| 2013 | 5367.58 | 1723.84 | 1655.47 | 551.38 | 578.42 | 1058.42 |
| 2014 | 5383.57 | 1425.81 | 1696.86 | 518.88 | 462.43 | 1059.16 |
| 2015 | 5353.93 | 1541.65 | 1735.51 | 531.73 | 491.47 | 1087.93 |
| 2016 | 5726.99 | 1614.13 | 1751.75 | 539.91 | 518.67 | 1213.82 |
| 2017 | 5856.36 | 1485.31 | 1713.38 | 521.80 | 548.98 | 1124.42 |
| 2018 | 5834.82 | 1378.99 | 1708.42 | 482.24 | 554.44 | 1206.30 |
| 2019 | 5624.64 | 1365.38 | 1723.61 | 463.22 | 538.39 | 1164.06 |
| 2020 | 4575.11 | 1366.31 | 1727.17 | 440.11 | 538.48 | 1161.67 |
| 2021 | 5204.63 | 1268.52 | 1727.93 | 418.85 | 510.67 | 1237.23 |
| 2022 | 5793.20 | 1281.04 | 1660.29 | 379.63 | 456.36 | 1125.97 |
| 2023 | 5363.65 | 1265.72 | 1631.98 | 376.77 | 452.82 | 1131.34 |
Jožef Stefan Institute - Energy Efficiency Centre
| Transport | Other | Agricultural | Waste | Energy | Industry and construction (with processes and use of solvents) | |||||||
|---|---|---|---|---|---|---|---|---|---|---|---|---|
| 2005 | 100 | 100 | 100 | 100 | 100 | 100 | ||||||
| 2006 | 105 | 91 | 100 | 94 | 102 | 109 | ||||||
| 2007 | 119 | 75 | 103 | 87 | 100 | 96 | ||||||
| 2008 | 140 | 88 | 98 | 78 | 91 | 93 | ||||||
| 2009 | 117 | 84 | 99 | 71 | 92 | 80 | ||||||
| 2010 | 120 | 85 | 97 | 69 | 96 | 81 | ||||||
| 2011 | 128 | 76 | 96 | 71 | 98 | 73 | ||||||
| 2012 | 129 | 66 | 95 | 69 | 95 | 74 | ||||||
| 2013 | 122 | 63 | 94 | 67 | 91 | 70 | ||||||
| 2014 | 122 | 52 | 96 | 63 | 73 | 70 | ||||||
| 2015 | 122 | 57 | 98 | 64 | 77 | 72 | ||||||
| 2016 | 130 | 59 | 99 | 65 | 82 | 81 | ||||||
| 2017 | 133 | 55 | 97 | 63 | 86 | 75 | ||||||
| 2018 | 133 | 51 | 97 | 58 | 87 | 80 | ||||||
| 2019 | 128 | 50 | 98 | 56 | 85 | 77 | ||||||
| 2020 | 104 | 50 | 98 | 53 | 85 | 77 | ||||||
| 2021 | 118 | 108 | 47 | 51 | 98 | 99 | 51 | 58 | 80 | 78 | 82 | 72 |
| 2022 | 132 | 108 | 47 | 48 | 94 | 99 | 46 | 56 | 72 | 77 | 75 | 71 |
| 2023 | 122 | 109 | 46 | 45 | 93 | 99 | 46 | 53 | 71 | 76 | 75 | 69 |
| 2024 | 109 | 42 | 99 | 51 | 74 | 67 | ||||||
| 2025 | 110 | 39 | 99 | 48 | 73 | 66 |
Jožef Stefan Institute - Energy Efficiency Centre


