[OD01] Municipal waste 

Key message

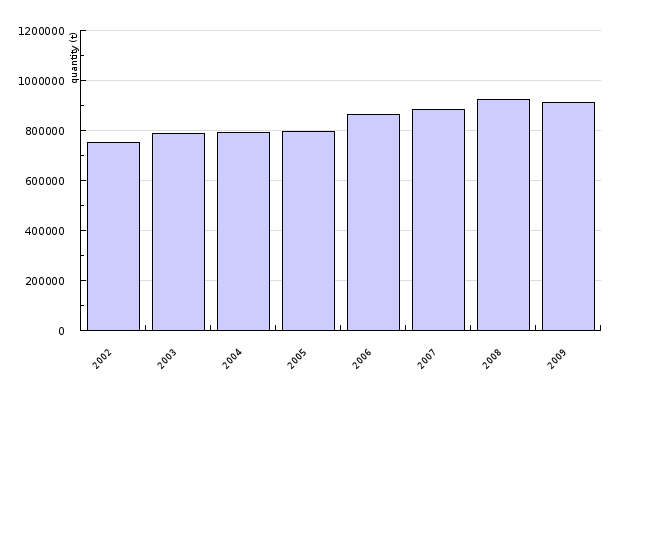
The quantity of municipal waste is increasing in Slovenia. In 2008, 922,829 tonnes of municipal waste was collected, i.e. 453 kg per capita. With regard to municipal waste management, disposal still prevails (71%).
Definition
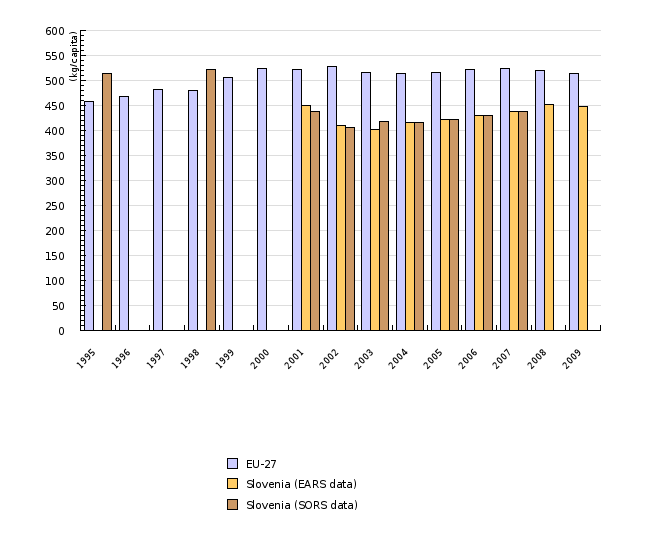
The indicator shows the quantity of municipal waste per capita in Slovenia and compares it with the average in the European Union.
Municipal waste is defined as from households and other waste which is by its nature and composition similar to household waste. According to the Environment Protection Act (Official Gazette of the Republic of Slovenia, Nos. 41/04, 17/06, 20/06 and 28/06) the municipal waste is collected and transported within the obligatory local public service of environmental protection.
Charts
Waste Management Database, Environmental Agency of the Republic of Slovenia, 2010; SI-STAT data portal, Environmental indicators, 2010.
| 2002 | 2003 | 2004 | 2005 | 2006 | 2007 | 2008 | 2009 | ||
|---|---|---|---|---|---|---|---|---|---|
| waste generated - non-hazardous and hazardous | t | 752807 | 786608 | 792046 | 797721 | 865620 | 885595 | 922829 | 912982 |
| waste generated - non-hazardous | t | 882688 | 919805 | 909405 | |||||
| waste generated - hazardous | t | 2907 | 3024 | 3577 |
Waste Management Database, Environmental Agency of the Republic of Slovenia, 2010; SI-STAT, Statistical Office of the Republic of Slovenia, 2010; Municipal waste generation, EUROSTAT, 2011
| 1995 | 1996 | 1997 | 1998 | 1999 | 2000 | 2001 | 2002 | 2003 | 2004 | ||
|---|---|---|---|---|---|---|---|---|---|---|---|
| EU-27 | kg per capita | 458 | 468 | 482 | 480 | 506 | 524 | 522 | 528 | 516 | 514 |
| Slovenia (EARS data) | kg per capita | np | np | np | np | np | np | 450 | 411 | 402 | 417 |
| Slovenia (SORS data) | kg per capita | 515 | np | np | 523 | np | np | 438 | 407 | 418 | 417 |
| Slovenia (EARS data) | t | np | np | np | np | np | np | 839436 | 752807 | 786608 | 792046 |
| 2005 | 2006 | 2007 | 2008 | 2009 | |||||||
| EU-27 | kg per capita | 517 | 523 | 524 | 520 | 514 | |||||
| Slovenia (EARS data) | kg per capita | 422 | 430 | 437 | 453 | 449 | |||||
| Slovenia (SORS data) | kg per capita | 422 | 431 | 439 | |||||||
| Slovenia (EARS data) | t | 797721 | 865620 | 885595 | 922829 | 912981 |
Waste Management Database, Environmental Agency of the Republic of Slovenia, 2010
| 2002 | 2003 | 2004 | 2005 | 2006 | 2007 | 2008 | 2009 | ||
|---|---|---|---|---|---|---|---|---|---|
| other operations of disposal | 1000 t | 1.7 | 0.1 | 0 | 0 | 0 | 0 | 0 | 0 |
| waste disposal | 1000 t | 712.8 | 693.5 | 667.7 | 672.3 | 731.8 | 800.9 | 762.7 | 634.4 |
| waste incineration | 1000 t | 0 | 0 | 0.2 | 1.2 | 6.3 | 0.2 | 0.2 | 0.2 |
| other operations of recovery | 1000 t | 4.9 | 6.2 | 1.8 | 3.5 | 4 | 2.4 | 3.1 | 0.5 |
| waste use as a fuel | 1000 t | 4.5 | 1.6 | 14.3 | 2.2 | 0 | 0.3 | 13.1 | 14 |
| recovery | 1000 t | 7.1 | 11.3 | 112 | 129.1 | 96.8 | 361.6 | 355.5 | 349.8 |
| other operations of disposal | % | 0.2 | 0 | 0 | 0 | 0 | 0 | 0 | 0 |
| waste disposal | % | 97.5 | 97.3 | 83.9 | 83.2 | 87.2 | 68.7 | 67.2 | 63.5 |
| waste incineration | % | 0 | 0 | 0 | 0.1 | 0.8 | 0 | 0 | 0 |
| other operations of recovery | % | 0.7 | 0.9 | 0.2 | 0.4 | 0.5 | 0.2 | 0.3 | 0.1 |
| waste use as a fuel | % | 0.6 | 0.2 | 1.8 | 0.3 | 0 | 0 | 1.2 | 1.4 |
| recovery | % | 1 | 1.6 | 14.1 | 16 | 11.5 | 31 | 31.3 | 35 |
Environment in the palm of your hand, 2007
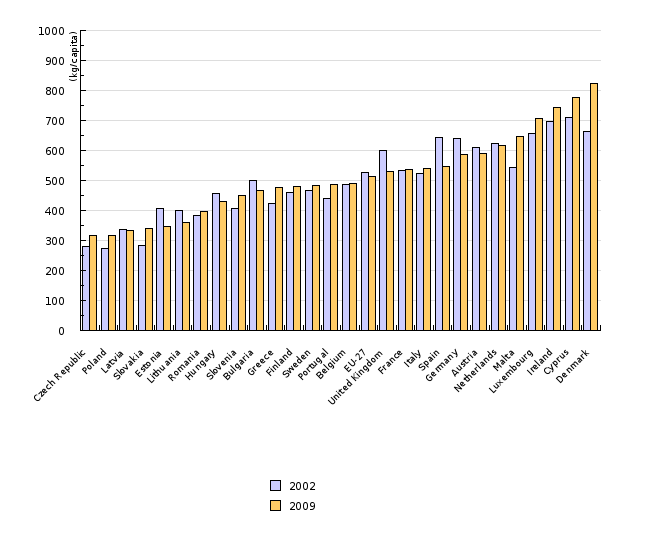
EUROSTAT, Municipal waste generated, 2011.
| Czech Republic | Poland | Latvia | Slovakia | Estonia | Lithuania | Romania | Hungary | Slovenia | Bulgaria | ||
|---|---|---|---|---|---|---|---|---|---|---|---|
| 2002 | kg per capita | 279 | 275 | 338 | 283 | 406 | 401 | 383 | 457 | 407 | 500 |
| 2005 | kg per capita | 289 | 319 | 310 | 289 | 436 | 376 | 377 | 460 | 423 | 475 |
| 2006 | kg per capita | 296 | 321 | 411 | 301 | 399 | 390 | 388 | 468 | 432 | 446 |
| 2007 | kg per capita | 294 | 322 | 377 | 309 | 448 | 400 | 378 | 456 | 441 | 468 |
| 2008 | kg per capita | 306 | 320 | 331 | 328 | 391 | 407 | 392 | 453 | 459 | 467 |
| 2009 | kg per capita | 316 | 316 | 333 | 339 | 346 | 360 | 396 | 430 | 449 | 468 |
| Greece | Finland | Sweden | Portugal | Belgium | EU-27 | United Kingdom | France | Italy | Spain | ||
| 2002 | kg per capita | 423 | 459 | 468 | 439 | 487 | 527 | 600 | 532 | 524 | 645 |
| 2005 | kg per capita | 438 | 479 | 482 | 446 | 481 | 517 | 585 | 532 | 542 | 597 |
| 2006 | kg per capita | 443 | 495 | 497 | 454 | 484 | 523 | 587 | 538 | 553 | 599 |
| 2007 | kg per capita | 448 | 507 | 518 | 472 | 497 | 524 | 572 | 544 | 550 | 588 |
| 2008 | kg per capita | 453 | 522 | 515 | 485 | 491 | 520 | 546 | 543 | 545 | 559 |
| 2009 | kg per capita | 478 | 481 | 485 | 488 | 491 | 514 | 529 | 536 | 541 | 547 |
| Germany | Austria | Netherlands | Malta | Luxembourg | Ireland | Cyprus | Denmark | ||||
| 2002 | kg per capita | 640 | 609 | 622 | 543 | 656 | 698 | 709 | 665 | ||
| 2005 | kg per capita | 564 | 620 | 624 | 624 | 678 | 740 | 739 | 737 | ||
| 2006 | kg per capita | 563 | 654 | 622 | 624 | 688 | 804 | 745 | 741 | ||
| 2007 | kg per capita | 582 | 598 | 630 | 652 | 700 | 788 | 754 | 792 | ||
| 2008 | kg per capita | 588 | 601 | 625 | 673 | 704 | 733 | 770 | 833 | ||
| 2009 | kg per capita | 587 | 591 | 616 | 647 | 707 | 742 | 778 | 822 |
Goals
- Separate collection of waste at source and effective treatment (mechanical, biological, thermal) of the waste remaining after separate collection.
- To reduce quantities of waste by combining producers’ and users’ behaviour patterns and habits, ways of life, technological improvements, economic activities and measures, and demographic changes.
Comment
Economic growth brings about increased use of natural resources and, consequently, larger quantities of waste are generated. This is particularly evident in households which have in recent years generated growing quantities of waste due to developed consumption and higher purchasing power of the population.
In Slovenia, municipal waste management is the responsibility of local communities; the majority of activities is now performed at intermunicipal level, and will be executed at regional level in the near future. All issues of waste management need to be resolved within the capacities of regional centres.
According to the Environmental Agency of the Republic of Slovenia, about 430 kg of municipal waste is generated per capita annually in Slovenia. According to the Statistical Office of the Republic of Slovenia for the years 1995 and 1998, the numbers were somewhat higher (515 and 523 kg per capita per year). However, the methodology for collecting data on waste generated was slightly different, so it would be difficult to conclude that the quantity of waste generated had fallen. According to the 2002 data, 411 kg of municipal waste per capita was generated in Slovenia.
In the period 2003-2007, the quantity of collected municipal waste increased from 402 kg to 437 kg per capita. In 2008, 922,829 tonnes of waste were generated and the quantity increased to 453 kg per capita. In the period 2003-2008, the quantity of collected municipal waste increased by 17 % in Slovenia.
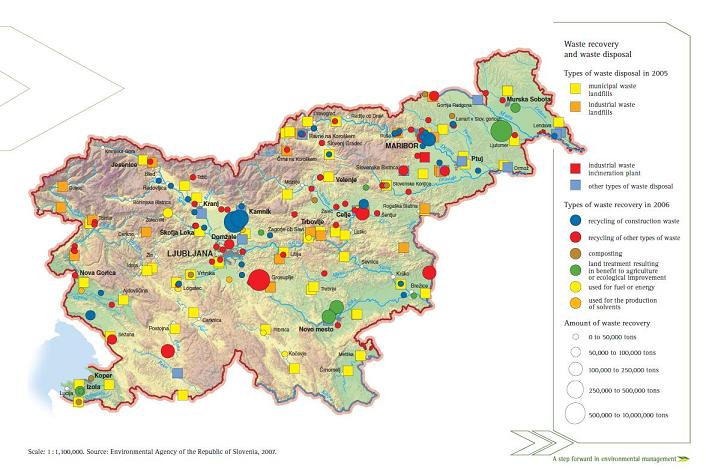
With regard to municipal waste management, disposal still prevails. In 2008, 71% (800 thousand tonnes) of waste were deposited. Compared to 2002, it is an increase of 30% in municipal waste disposal. In 2008, 29 % of municipal waste (360 thousand tonnes) were recycled, which actually is by 44-times more than in 2002, but the share of recycling remains too small in comparison to waste disposal.
In view of the amendments in the legislation, the establishment of regional waste management centres, taxes and financial guarantees provided for landfill operators, the deposited quantities of waste are expected to decrease.
In spite of growing quantities of generated municipal waste, Slovenia still remains rather bellow the European average, since the EU-27 average of collected waste amounted to 522 kg per capita in 2007. However, the methodologies for collecting data are not fully comparable. The quantity of municipal waste is increasing in most EU-27 Member States. The Fifth Environmental Action Programme set out a goal of stabilising the municipal waste generation across the EU at 300 kg/capita per year by 2000; however, this goal proved to be difficult to reach – as soon as in 2004, the average quantity in the EU was around 500 kg/capita per year.
In the recent past, the European Union in terms of the waste management hierarchy increasingly started to underline the prevention of waste generation in addition to effective collection and separation of municipal waste. In this respect we are rather in the initial stage in Slovenia, since changes are urgently needed in both the manufacture of products and environmental awareness of the population. The quantity of waste can namely be reduced in every household by selection of reusable products without unnecessary packaging or at least with reusable packaging, long useful life and similar.
Methodology
Data for Slovenia:
Objectives summarized by: Resolution on National Environmental Action Plan 2005-2012 (ReNPVO, Official Gazette of the Republic of Slovenia, No. 2/06)
Source database or source: Analysis of waste management annual reports; Waste Management Database, Environmental Agency of the Republic of Slovenia.
Data administrator: Environmental Agency of the Republic of Slovenia.
Data acquisition date for this indicator: 9 December 2009
Methodology and frequency of data collection for the indicator: Data have been captured for the 1995-2007 period. The Ministry of the Environment and Spatial Planning – Environmental Agency of the Republic of Slovenia has been monitoring the generation of municipal waste since 2001. In accordance with the Order on the management of separately collected fractions in the public service of urban waste management (Official Gazette of the Republic of Slovenia, No. 21/01) the providers of public municipal waste collection service report on collected quantities to the Environmental Agency of the Republic of Slovenia once a year (on 31 March) using a special report form. The content of each submitted and completed form is checked. If it contains irregularities, the data are reconciled with the contractor. The reports acquired are entered into the database. The data on the collected quantities are used to estimate the quantity of generated municipal waste.
The quantities of generated municipal waste have also been monitored by the Statistical Office of the Republic of Slovenia and are published in the SI-STAT web database.
Until 2007, data on hazardous municipal waste were captured together with municipal waste; after 2007, however, hazardous municipal waste has been recorded separately, so that the quantities of municipal waste for the years 2007 and 2008, as compared to the preceding years, only contain the collected quantities of non-hazardous municipal waste.
In 2008, the methodology of gathering and processing of data on collected quantities of waste was harmonised, so that the data of the Environmental Agency of the Republic of Slovenia and of the Statistical Office of the Republic of Slovenia are now coordinated and will no longer be reported separately.
The size of population for indicator calculation has been taken from the Statistical Yearbook (December data for the current year). Data for EU-27 (Municipal waste generated) have been taken from the Eurostat web database of December 2009.
Data processing methodology:
The graph in Figure OD1-1 presents data on the collected quantity of municipal waste in Slovenia gathered by the Environmental Agency of the Republic of Slovenia and by the Statistical Office of the Republic of Slovenia. Quantities of municipal waste have been converted to data per capita, taking into account the size of population as at 31 December of the current year.
Data on collected quantity of municipal waste in the EU-27 were taken from Eurostat database (Municipal waste generated) with already calculated quantities of municipal waste per capita.
Figure OD1-2, however, shows the shares of recovery and disposal of municipal waste in Slovenia in the 2002-2008 period.
Information concerning data quality:
- Advantages and disadvantages of the indicator: the methodologies for gathering data on municipal waste of the Environmental Agency of the Republic of Slovenia and of the Statistical Office of the Republic of Slovenia were somewhat different in the past years, and therefore these data are not directly comparable and show deviations.
- Relevance, accuracy, robustness, uncertainty:
Reliability of the indicator (archival data):/
Uncertainty of the indicator (scenarios/projections):/
- Overall assessment (1 = no major comments, 3 = data to be considered with reservation);
Relevance: 1
Accuracy: 1
Completeness over time: 2
Completeness over space: 1
Other sources and literature:
- ENVIRONMENT IN THE PALM OF YOUR HAND: Slovenia. 2007. Ljubljana, The Ministry of the Environment and Spatial Planning, Environmental Agency of the Republic of Slovenia, 112 pages.
- EUROSTAT, 2009. Municipal waste generated.(cited as at 9 December 2009).


