[ZD17] Levels of lead in children's blood in the Upper Meža Valley

Key message

Due to high levels of lead in the environment has been an area of Upper Mežica Valley in 2007 proclaimed as a brownfield site and receive special rehabilitation with the aim to protect human health, especially children. The data show that the burden of children with lead improved in the first years of the program, while it stays pretty much on the same level in the last years. For further improvement will be the key appropriate measures implemented, improving the living environment and the continued maintenance of progress. In the future it will be required more targeted work with smaller groups and individual children, in which will be found an increased risk of lead and individual-oriented advice in favor of improving the state of lead in the blood of a child.
Charts
National Institute of Public Health OE Ravne na Koroškem, 2015
| 2004 | 2005 | 2006 | 2007 | 2008 | 2009 | 2010 | 2011 | 2012 | 2013 | ||
|---|---|---|---|---|---|---|---|---|---|---|---|
| number of children | numb. | 20 | 42 | 50 | 70 | 73 | 74 | 116 | 110 | 84 | 61 |
| maximum level of lead | µg/l | 375 | 303 | 480 | 500 | 358 | 208 | 301 | 221 | 279 | 330 |
| minimum level of lead | µg/l | 23 | 19 | 10 | 16 | 13 | 17 | 9 | 21 | 15 | 12 |
| average lead | µg/l | 174.8 | 113.6 | 115.3 | 97.8 | 82.4 | 65.6 | 46.6 | 57.3 | 65.6 | 56.2 |
| more than 100 µg/l | % | 0.9 | 0.5 | 0.5 | 0.5 | 0.2 | 0.2 | 0.1 | 0.1 | 0.1 | 0.1 |
| 50 µg/l or more and less than 100 µg/l | % | 0.1 | 0.3 | 0.3 | 0.3 | 0.5 | 0.3 | 0.2 | 0.3 | 0.3 | 0.2 |
| less than 50 µg/l | % | 0.1 | 0.2 | 0.2 | 0.2 | 0.3 | 0.5 | 0.7 | 0.6 | 0.5 | 0.7 |
| 2014 | 2015 | ||||||||||
| number of children | numb. | 66 | 83 | ||||||||
| maximum level of lead | µg/l | 517 | 321 | ||||||||
| minimum level of lead | µg/l | 22 | 19 | ||||||||
| average lead | µg/l | 76.2 | 65.1 | ||||||||
| more than 100 µg/l | % | 0.2 | 0.1 | ||||||||
| 50 µg/l or more and less than 100 µg/l | % | 0.3 | 0.3 | ||||||||
| less than 50 µg/l | % | 0.5 | 0.6 |
National Institute of Pubilc Health OE Ravne na Koroškem, 2014
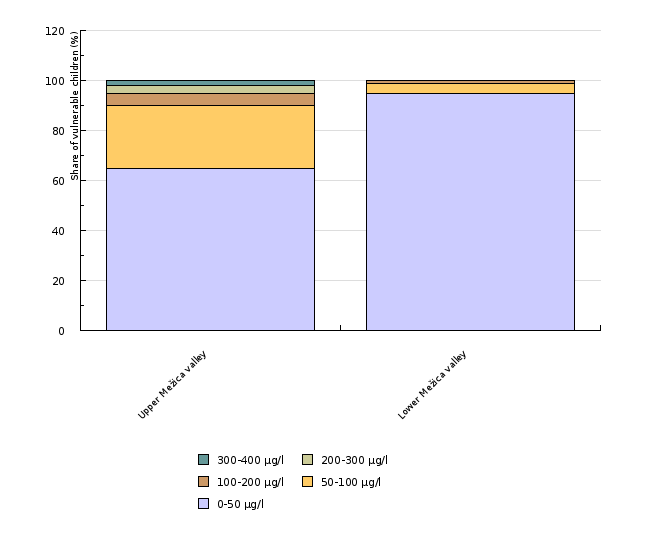
| Upper Mežica valley | Lower Mežica valley | ||
|---|---|---|---|
| 0-50 µg/l | µg/l | 40 | 88 |
| 50-100 µg/l | µg/l | 15 | 4 |
| 100-200 µg/l | µg/l | 3 | 1 |
| 200-300 µg/l | µg/l | 2 | 0 |
| 300-400 µg/l | µg/l | 1 | 0 |
| number of children | numb. | 61 | 93 |
| 0-50 µg/l | % | 65 | 95 |
| 50-100 µg/l | % | 25 | 4 |
| 100-200 µg/l | % | 5 | 1 |
| 200-300 µg/l | % | 3 | 0 |
| 300-400 µg/l | % | 2 | 0 |
National Institute of Public Health OE Ravne na Koroškem, 2014
| 2008 | 2013 | ||
|---|---|---|---|
| 0-50 µg/l | µg/l | 100 | 180 |
| 50-100 µg/l | µg/l | 95 | 52 |
| 100-200 µg/l | µg/l | 39 | 12 |
| 200-300 µg/l | µg/l | 5 | 5 |
| 300-400 µg/l | µg/l | 3 | 1 |
| number of children | numb. | 242 | 250 |
| average - lead | µg/l | 73 | 47 |
| maximum level of lead | µg/l | 393 | 330 |
| 0-50 µg/l | % | 41.3 | 72 |
| 50-100 µg/l | % | 39.3 | 20.8 |
| 100-200 µg/l | % | 16.1 | 4.8 |
| 200-300 µg/l | % | 2.1 | 2 |
| 300-400 µg/l | % | 1.2 | 0.4 |
National Institute of Public Health OE Ravne na Koroškem, 2014
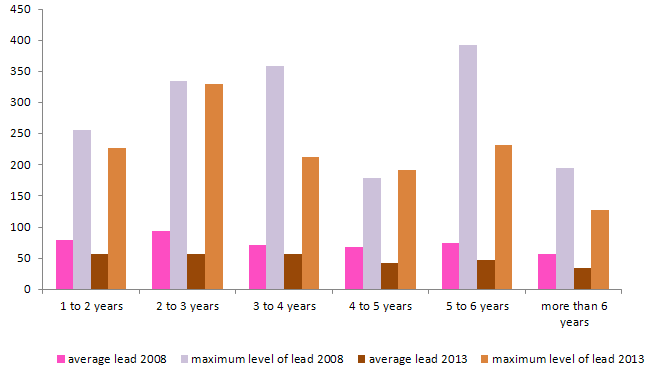
| 1 to 2 years | 2 to 3 years | 3 to 4 years | 4 to 5 years | 5 to 6 years | more than 6 years | ||
|---|---|---|---|---|---|---|---|
| number of children 2008 | numb. | 41 | 35 | 38 | 31 | 48 | 49 |
| average lead 2008 | µg/l | 79 | 94 | 71 | 68 | 74 | 56 |
| maximum level of lead 2008 | µg/l | 256 | 335 | 358 | 178 | 393 | 195 |
| number of children 2013 | numb. | 31 | 26 | 35 | 51 | 46 | 33 |
| average lead 2013 | µg/l | 56 | 57 | 56 | 43 | 47 | 35 |
| maximum level of lead 2013 | µg/l | 227 | 330 | 212 | 192 | 232 | 127 |
National Institute of Public Health OE Ravne na Koroškem, 2014
| 2004 | 2005 | 2006 | 2007 | 2008 | 2009 | 2010 | 2011 | 2012 | 2013 | ||
|---|---|---|---|---|---|---|---|---|---|---|---|
| children with more than 100 µg/l | % | 85 | 55 | 50 | 46 | 21 | 18 | 9 | 9 | 14 | 10 |
| 2014 | 2015 | 2016 | 2017 | ||||||||
| children with more than 100 µg/l | % | 17 | 12 |
National Institute of Public Health OE Ravne na Koroškem, 2010
ENHIS; Levels of lead in children’s blood, december 2009.
| Romania, 1-9 years, 1999/00 | Hungary, 4-6 years, 1996 | Hungary, 4-6 years, 2006 | Bulgaria, 6-15 years, 2003* | Russia, 2-6 years, 1997 | Russia, 8-9 years, 2003/05 | Slovenia, 3 years, 2008 | France, 1-6 years, 1995/96 | France, 0,5-6 years, 2002/04 | Poland, 8-13 years, 2000 | ||
|---|---|---|---|---|---|---|---|---|---|---|---|
| lead exposure | µg/l | 104 | 61 | 19 | 58 | 56 | 30 | 47 | 37 | 24 | 36 |
| Czech Republic, 8-11 years, 1996/01 | Czech Republic, 8-10 years, 2006 | Germany, 6-14 years, 1990/92 | Germany, 3-14 years, 2003/06 | Sweden, 3-19 years, 1991/94 | Sweden, 7-11 years, 2007 | Belgium, 14-15 years, 2003/04 | Ukraine, 3-7 years, 1990/04 | ||||
| lead exposure | µg/l | 34 | 28 | 32 | 15 | 27 | 13 | 21 | 16 |
ENHIS; Levels of lead in children’s blood, december 2009.
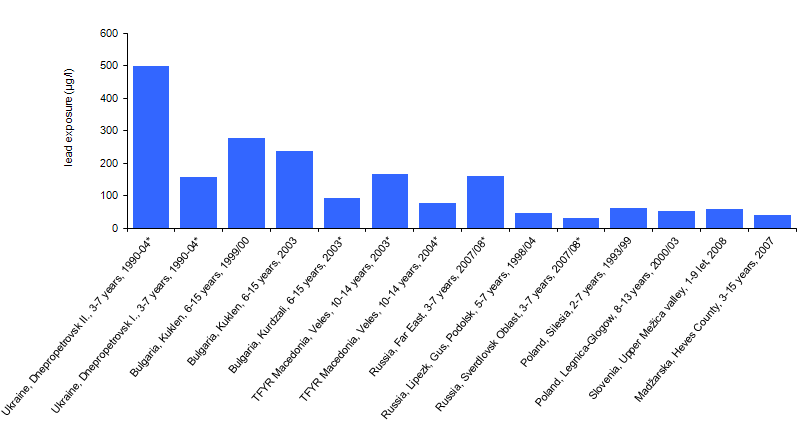
| Ukraine, Dnepropetrovsk II., 3-7 years, 1990-04* | Ukraine, Dnepropetrovsk I., 3-7 years, 1990-04* | Bulgaria, Kuklen, 6-15 years, 1999/00 | Bulgaria, Kuklen, 6-15 years, 2003 | Bulgaria, Kurdzali, 6-15 years, 2003* | TFYR Macedonia, Veles, 10-14 years, 2003* | TFYR Macedonia, Veles, 10-14 years, 2004* | Russia, Far East, 3-7 years, 2007/08* | Russia, Lipezk, Gus, Podolsk, 5-7 years, 1998/04 | Russia, Sverdlovsk Oblast, 3-7 years, 2007/08* | ||
|---|---|---|---|---|---|---|---|---|---|---|---|
| lead exposure | µg/l | 498 | 156 | 276 | 236 | 93 | 165 | 76 | 159 | 46 | 32 |
| Poland, Silesia, 2-7 years, 1993/99 | Poland, Legnica-Glogow, 8-13 years, 2000/03 | Slovenia, Upper Mežica valley, 1-9 let, 2008 | Madžarska, Heves County, 3-15 years, 2007 | ||||||||
| lead exposure | µg/l | 63 | 53 | 59 | 40 |


