[PP11] Heating and cooling degree days 

Key message

Comparison of periods 1961-1990 and 1991-2020 on the chosen representative stations around Slovenia shows decrease of heating degree days by around 10 % and multiple increase of cooling degree days. With projected continuous temperature raise until the end of 21st century, those trends are expected to continue. Thus, in Slovenia, energy demand for cooling will increase in the warmer period of the year, while the energy demand for heating will decrease in colder period of the year. Same trend is projected for Europe in general.
Charts
Slovenian Environment Agency, 2023
| Kredarica[Kday] | Rateče[Kday] | Murska Sobota[Kday] | Novo mesto[Kday] | Ljubljana[Kday] | Bilje[Kday] | |
|---|---|---|---|---|---|---|
| 1961 | 7682 | 4363 | 2937 | 2873 | ||
| 1962 | 7935 | 4809 | 3527 | 3574 | 3347 | |
| 1963 | 8245 | 5148 | 4044 | 3917 | 3736 | 2895 |
| 1964 | 7626 | 4552 | 3686 | 3550 | 3319 | 2502 |
| 1965 | 8101 | 4960 | 3588 | 3682 | 3464 | 2663 |
| 1966 | 7883 | 4682 | 3349 | 3239 | 3166 | 2496 |
| 1967 | 8035 | 4636 | 3204 | 3275 | 3124 | 2445 |
| 1968 | 7716 | 4490 | 3311 | 3146 | 3065 | 2372 |
| 1969 | 8065 | 4880 | 3637 | 3519 | 3438 | 2572 |
| 1970 | 8225 | 5039 | 3682 | 3654 | 3476 | 2680 |
| 1971 | 7943 | 4821 | 3446 | 3371 | 3277 | 2561 |
| 1972 | 7685 | 4722 | 3533 | 3570 | 3386 | 2580 |
| 1973 | 8095 | 4948 | 3800 | 3714 | 3584 | 2800 |
| 1974 | 7829 | 4619 | 3456 | 3321 | 3192 | 2554 |
| 1975 | 7958 | 4705 | 3295 | 3244 | 3177 | 2672 |
| 1976 | 7836 | 4603 | 3653 | 3536 | 3474 | 2694 |
| 1977 | 7947 | 4641 | 3229 | 3086 | 2960 | 2223 |
| 1978 | 8066 | 4979 | 3610 | 3503 | 3409 | 2662 |
| 1979 | 7960 | 5107 | 3755 | 3534 | 3553 | 2802 |
| 1980 | 8208 | 5022 | 3694 | 3496 | 3440 | 2822 |
| 1981 | 7866 | 4956 | 3640 | 3438 | 3503 | 2924 |
| 1982 | 8017 | 4785 | 3551 | 3419 | 3378 | 2871 |
| 1983 | 7514 | 4248 | 3053 | 2850 | 2937 | 2472 |
| 1984 | 7985 | 4917 | 3745 | 3509 | 3517 | 2962 |
| 1985 | 7998 | 4839 | 3757 | 3523 | 3440 | 2840 |
| 1986 | 7689 | 4627 | 3507 | 3421 | 3357 | 2689 |
| 1987 | 7920 | 5039 | 3866 | 3596 | 3568 | 2944 |
| 1988 | 7552 | 4299 | 3150 | 2979 | 2978 | 2451 |
| 1989 | 7359 | 4464 | 3250 | 3116 | 3110 | 2661 |
| 1990 | 7361 | 4383 | 3102 | 2950 | 2987 | 2707 |
| 1991 | 7991 | 4959 | 3574 | 3350 | 3295 | 2654 |
| 1992 | 7614 | 4397 | 3236 | 3138 | 3149 | 2692 |
| 1993 | 7243 | 4348 | 3241 | 3063 | 3019 | 2570 |
| 1994 | 7677 | 4447 | 3006 | 2899 | 2826 | 2315 |
| 1995 | 7498 | 4321 | 3172 | 3099 | 3012 | 2485 |
| 1996 | 7773 | 4655 | 3596 | 3350 | 3179 | 2586 |
| 1997 | 7766 | 4522 | 3438 | 3286 | 3068 | 2455 |
| 1998 | 7502 | 4236 | 3160 | 2961 | 2875 | 2425 |
| 1999 | 7668 | 4565 | 3317 | 3193 | 3074 | 2596 |
| 2000 | 7475 | 4157 | 3122 | 2993 | 2918 | 2498 |
| 2001 | 7404 | 3972 | 2647 | 2447 | 2463 | 1991 |
| 2002 | 7359 | 4296 | 3136 | 2984 | 2906 | 2400 |
| 2003 | 7584 | 4161 | 3400 | 3186 | 2950 | 2327 |
| 2004 | 7621 | 4658 | 3348 | 3197 | 3113 | 2564 |
| 2005 | 7670 | 4506 | 3338 | 3139 | 3049 | 2533 |
| 2006 | 7815 | 4765 | 3485 | 3269 | 3185 | 2579 |
| 2007 | 6878 | 3669 | 2563 | 2229 | 2146 | 1879 |
| 2008 | 7609 | 4417 | 3181 | 3119 | 3060 | 2509 |
| 2009 | 7682 | 4398 | 2925 | 2920 | 2870 | 2229 |
| 2010 | 7670 | 4288 | 3104 | 2997 | 2992 | 2440 |
| 2011 | 7580 | 4237 | 3123 | 3089 | 2862 | 2349 |
| 2012 | 7342 | 4109 | 3158 | 3047 | 2954 | 2491 |
| 2013 | 7484 | 4407 | 3091 | 3028 | 2899 | 2391 |
| 2014 | 7105 | 4005 | 2554 | 2367 | 2288 | 1731 |
| 2015 | 7433 | 3813 | 2672 | 2578 | 2523 | 2052 |
| 2016 | 7002 | 4156 | 2850 | 2736 | 2681 | 2252 |
| 2017 | 7239 | 4071 | 3180 | 2993 | 2822 | 2329 |
| 2018 | 7371 | 4239 | 2903 | 2778 | 2720 | 2333 |
| 2019 | 7214 | 4091 | 2893 | 2814 | 2607 | 2151 |
| 2020 | 6978 | 3950 | 2696 | 2481 | 2369 | 1981 |
| 2021 | 7393 | 4424 | 3108 | 2913 | 2911 | 2422 |
| 2022 | 7165 | 4215 | 3081 | 3001 | 2895 | 2486 |
Slovenian Environment Agency, 2023
| Kredarica[Kday] | Rateče[Kday] | Murska Sobota[Kday] | Novo mesto[Kday] | Ljubljana[Kday] | Bilje[Kday] | |
|---|---|---|---|---|---|---|
| 1961 | 0 | 0 | 42 | 48 | ||
| 1962 | 0 | 0 | 25 | 22 | 47 | |
| 1963 | 0 | 0 | 67 | 51 | 72 | 95 |
| 1964 | 0 | 0 | 13 | 13 | 38 | 92 |
| 1965 | 0 | 0 | 26 | 25 | 46 | 60 |
| 1966 | 0 | 0 | 13 | 15 | 26 | 64 |
| 1967 | 0 | 0 | 54 | 41 | 71 | 132 |
| 1968 | 0 | 5 | 41 | 36 | 53 | 77 |
| 1969 | 0 | 0 | 23 | 16 | 43 | 76 |
| 1970 | 0 | 0 | 36 | 28 | 70 | 97 |
| 1971 | 0 | 2 | 38 | 31 | 64 | 108 |
| 1972 | 0 | 0 | 31 | 28 | 37 | 96 |
| 1973 | 0 | 0 | 24 | 24 | 27 | 98 |
| 1974 | 0 | 0 | 51 | 45 | 63 | 108 |
| 1975 | 0 | 0 | 8 | 10 | 17 | 59 |
| 1976 | 0 | 1 | 17 | 26 | 31 | 56 |
| 1977 | 0 | 0 | 18 | 24 | 23 | 36 |
| 1978 | 0 | 0 | 3 | 10 | 9 | 34 |
| 1979 | 0 | 0 | 23 | 28 | 32 | 83 |
| 1980 | 0 | 0 | 14 | 26 | 36 | 52 |
| 1981 | 0 | 0 | 39 | 47 | 41 | 67 |
| 1982 | 0 | 0 | 20 | 38 | 55 | 130 |
| 1983 | 0 | 10 | 55 | 59 | 77 | 70 |
| 1984 | 0 | 3 | 14 | 28 | 26 | 23 |
| 1985 | 0 | 0 | 33 | 41 | 64 | 72 |
| 1986 | 0 | 1 | 37 | 42 | 63 | 95 |
| 1987 | 0 | 0 | 56 | 52 | 59 | 93 |
| 1988 | 0 | 0 | 72 | 77 | 107 | 108 |
| 1989 | 0 | 0 | 31 | 24 | 34 | 60 |
| 1990 | 0 | 0 | 30 | 44 | 58 | 65 |
| 1991 | 0 | 2 | 62 | 65 | 87 | 134 |
| 1992 | 0 | 6 | 145 | 94 | 123 | 139 |
| 1993 | 0 | 2 | 85 | 106 | 103 | 135 |
| 1994 | 0 | 7 | 109 | 121 | 145 | 229 |
| 1995 | 0 | 3 | 44 | 54 | 83 | 145 |
| 1996 | 0 | 0 | 31 | 36 | 47 | 72 |
| 1997 | 0 | 0 | 31 | 22 | 35 | 85 |
| 1998 | 0 | 5 | 90 | 116 | 153 | 204 |
| 1999 | 0 | 0 | 55 | 70 | 81 | 124 |
| 2000 | 0 | 1 | 131 | 144 | 129 | 132 |
| 2001 | 0 | 0 | 103 | 125 | 143 | 168 |
| 2002 | 0 | 10 | 86 | 75 | 91 | 134 |
| 2003 | 0 | 15 | 237 | 250 | 267 | 376 |
| 2004 | 0 | 3 | 46 | 62 | 83 | 129 |
| 2005 | 0 | 4 | 56 | 77 | 90 | 139 |
| 2006 | 0 | 19 | 110 | 142 | 159 | 209 |
| 2007 | 0 | 6 | 146 | 119 | 137 | 157 |
| 2008 | 0 | 3 | 107 | 100 | 128 | 170 |
| 2009 | 0 | 6 | 79 | 107 | 143 | 199 |
| 2010 | 0 | 17 | 108 | 127 | 144 | 157 |
| 2011 | 0 | 8 | 95 | 129 | 157 | 202 |
| 2012 | 0 | 14 | 166 | 189 | 218 | 306 |
| 2013 | 0 | 28 | 175 | 169 | 205 | 245 |
| 2014 | 0 | 1 | 67 | 68 | 80 | 82 |
| 2015 | 0 | 28 | 183 | 209 | 238 | 275 |
| 2016 | 0 | 4 | 85 | 101 | 138 | 218 |
| 2017 | 0 | 1 | 147 | 202 | 218 | 233 |
| 2018 | 0 | 13 | 120 | 96 | 174 | 228 |
| 2019 | 0 | 27 | 146 | 168 | 211 | 304 |
| 2020 | 0 | 5 | 66 | 99 | 121 | 172 |
| 2021 | 0 | 9 | 149 | 176 | 207 | 238 |
| 2022 | 0 | 12 | 132 | 174 | 279 | 401 |
Slovenian Environment Agency, 2020
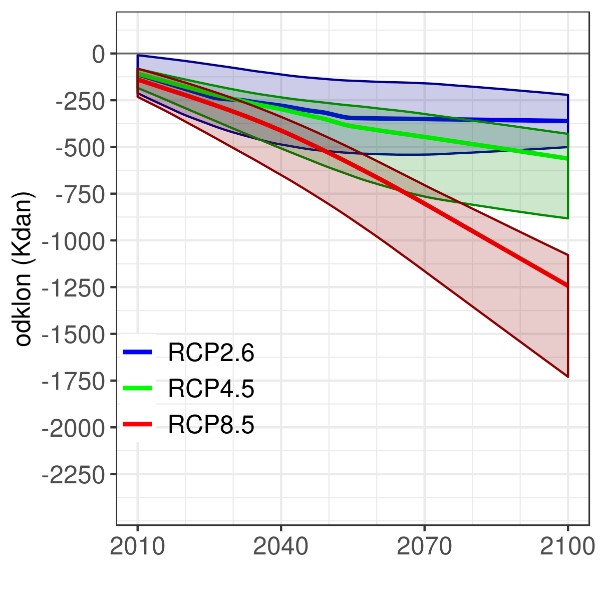
The timeline of change in average annual heating degree days in Slovenia over the 21st century for three scenarios relative to the reference period 1981-2010. Bold coloured curves show smoothed model median and lighter colours show model spread.
Slovenian Environment Agency, 2020
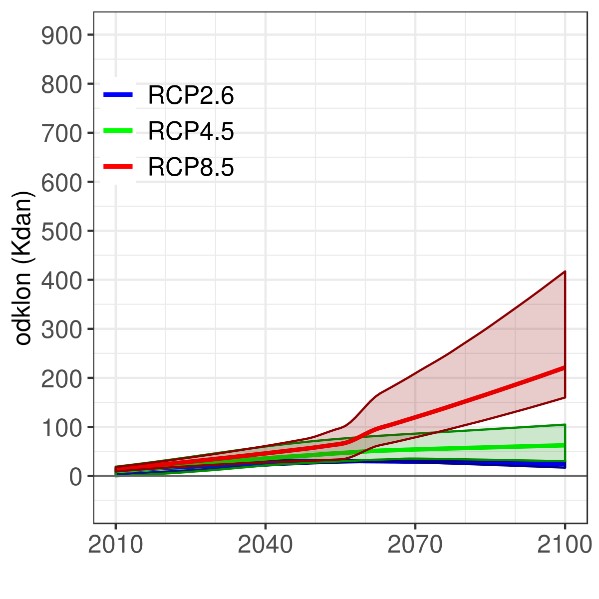
The timeline of change in average annual cooling degree days in Slovenia over the 21st century for three scenarios relative to the reference period 1981-2010. Bold coloured curves show smoothed model median and lighter colours show model spread.
Slovenian Environment Agency, 2020
Slovenian Environment Agency, 2020
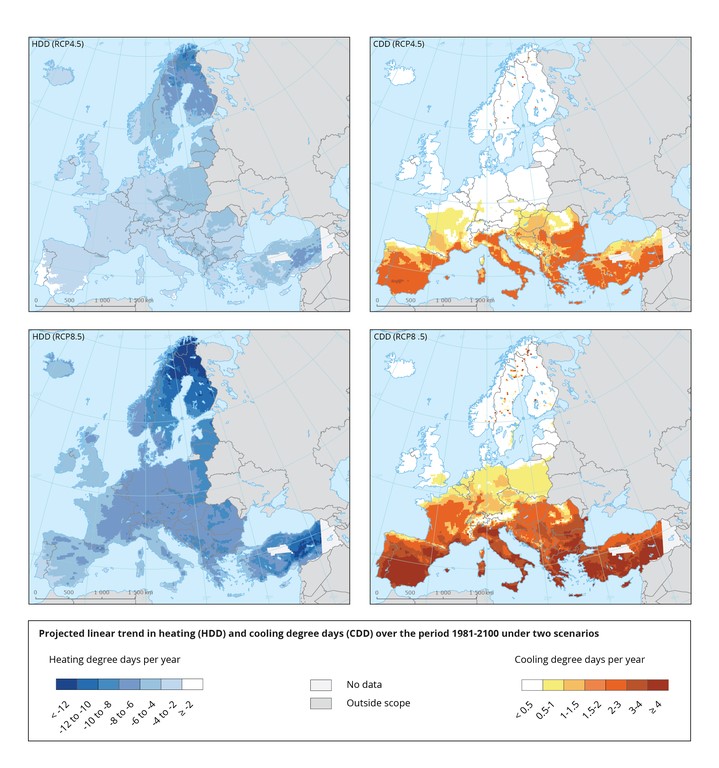
EEA, 2019
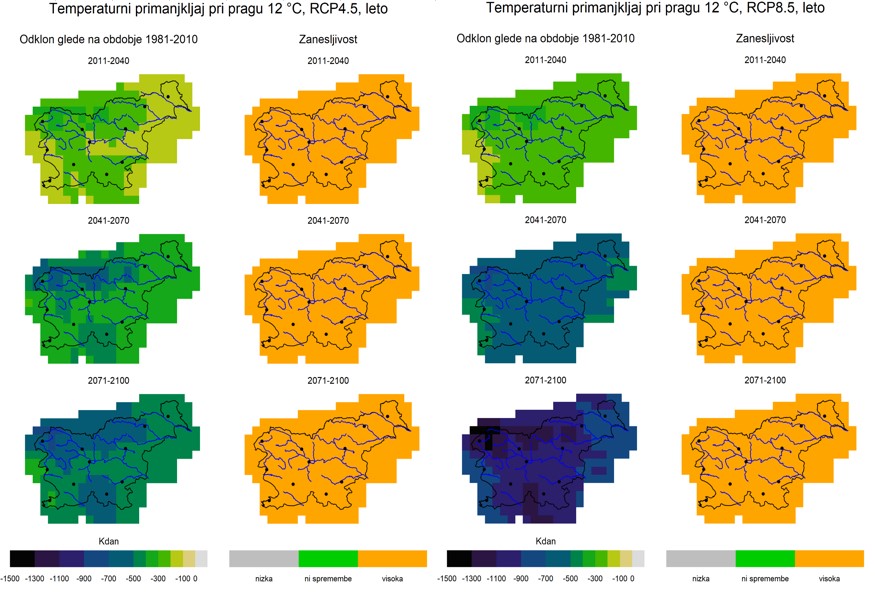
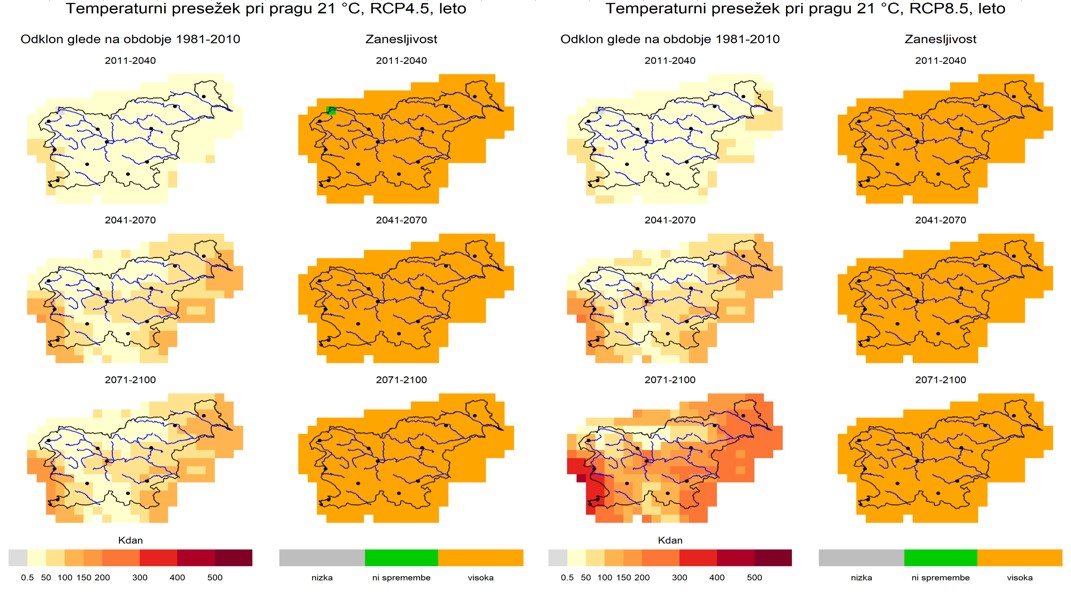
These maps show the trend in heating degree days (left) and cooling degree days (right) from 1981-2100 under the RCP4.5 (upper panels) and RCP8.5 (lower panels). Projections are based on the median of an ensemble of 11 EURO-CORDEX simulations.
Methodology
- Agencija RS za okolje, 2021. Temperaturni primanjkljaj in presežek ter kurilna sezona 1961-2023.
- Evropska agencija za okolje, 2021. Heating and cooling degree days.
- IPCC, 2014a: Climate Change 2014: Impacts, Adaptation, and Vulnerability. Part A: Global and Sectoral Aspects. Contribution of Working Group II to the Fifth Assessment Report of the Intergovernmental Panel on Climate Change [Field, C.B., V.R. Barros, D.J. Dokken, K.J. Mach, M.D. Mastrandrea, T.E. Bilir, M. Chatterjee, K.L. Ebi, Y.O. Estrada, R.C. Genova, B. Girma, E.S. Kissel, A.N. Levy, S. MacCracken, P.R. Mastrandrea, and L.L. White (eds.)]. Cambridge University Press, Cambridge, United Kingdom and New York, NY, USA, 1132 pp.
- IPCC, 2014c: Europe. Kovats, R.S., R. Valentini, L.M. Bouwer, E. Georgopoulou, D. Jacob, E. Martin, M. Rounsevell, and J.-F. Soussana, 2014: Europe. In: Climate Change 2014: Impacts, Adaptation, and Vulnerability. Part B: Regional Aspects. Contribution of Working Group II to the Fifth Assessment Report of the Intergovernmental Panel on Climate Change [Barros, V.R., C.B. Field, D.J. Dokken, M.D. Mastrandrea, K.J. Mach, T.E. Bilir, M. Chatterjee, K.L. Ebi, Y.O. Estrada, R.C. Genova, B. Girma, E.S. Kissel, A.N. Levy, S. MacCracken, P.R. Mastrandrea, and L.L. White (eds.)]. Cambridge University Press, Cambridge, United Kingdom and New York, NY, USA, pp. 1267-1326.


