[EN12] Electricity consumption

Key message

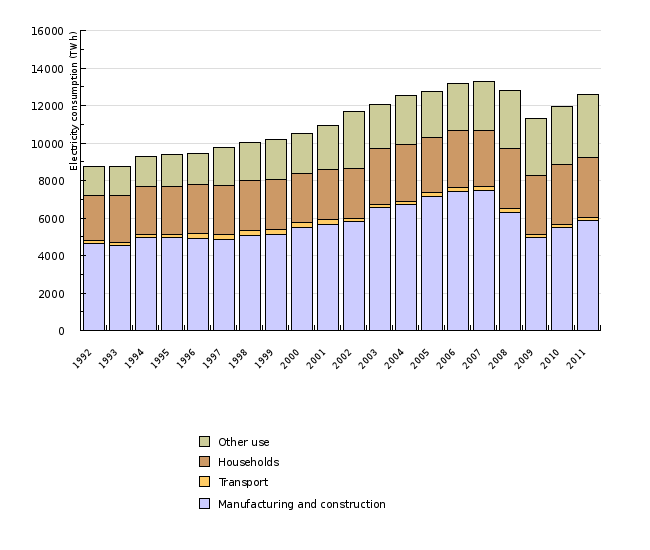
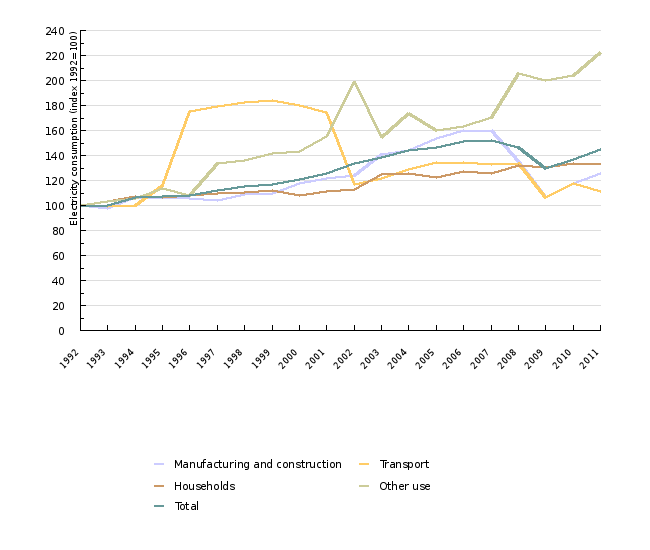
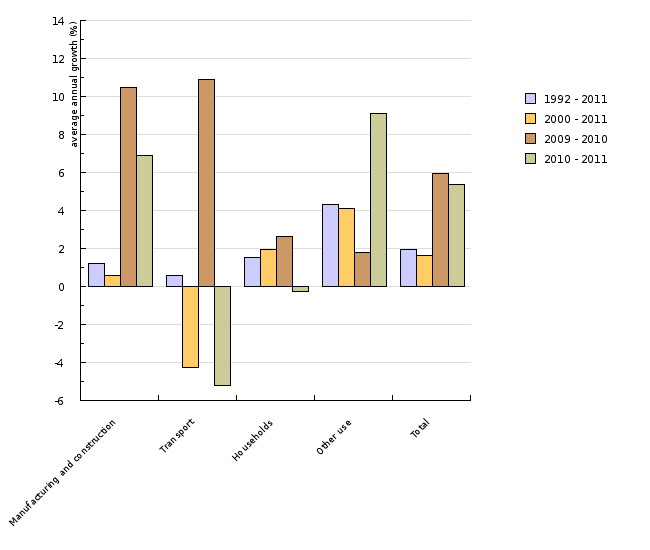
In 2011, electricity consumption increased due to some economic growth. In 2000-2011 period, the average consumption growth was 1.7% per annum, which matches the projections in the current NEP.
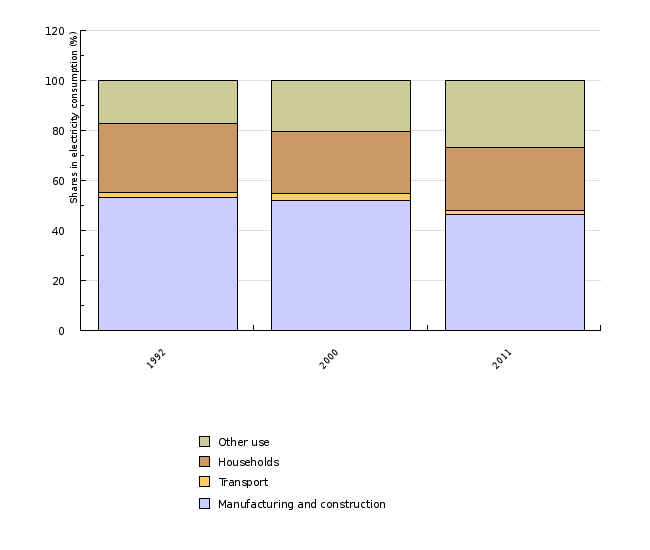
Compared to the year 2000, the biggest growth was recorded in services sector, followed by the households.
Definition
Electricity consumption is the electricity consumption of the final energy demand sectors. This indicator does not include own use by power plants and distribution losses. It includes electricity consumption in manufacturing and construction, transport, households and other use.
Trends of electricity consumption influence its production. This connection is not formed only on the state level, as the liberalisation of the electricity market ideally means that requirements for electricity can be met from any power plant across Europe. It still holds true though, especially due to limitations in electricity transmissions, that a greater requirement for electricity in Slovenia influences higher production in Slovenia. It is for this reason that information on trends of electricity consumption is a good indicator of environmental impacts caused by the production of electricity.
Charts
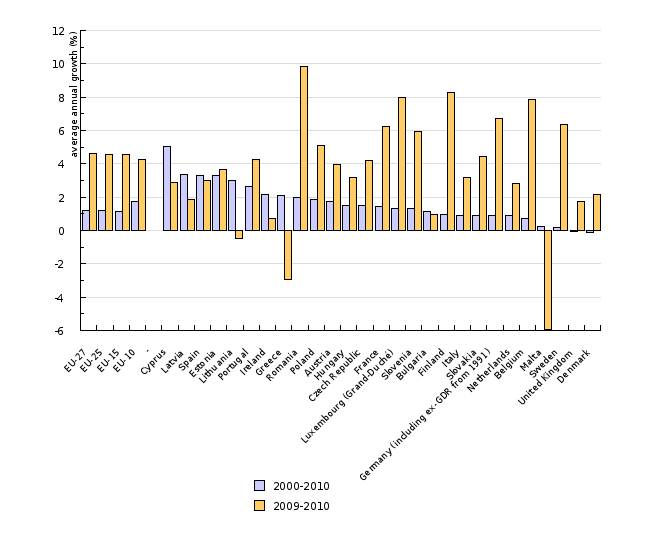
Statistical Office of the Republic of Slovenia, 2012; Eurostat, 2012.
| 1992 | 1993 | 1994 | 1995 | 1996 | 1997 | 1998 | 1999 | 2000 | 2001 | ||
|---|---|---|---|---|---|---|---|---|---|---|---|
| Manufacturing and construction | GWh | 4660 | 4553 | 4956 | 4943 | 4921 | 4853 | 5055 | 5099 | 5490 | 5648 |
| Transport | GWh | 147 | 146 | 147 | 170 | 258 | 264 | 268 | 271 | 265 | 256 |
| Households | GWh | 2404 | 2490 | 2585 | 2553 | 2594 | 2637 | 2658 | 2692 | 2601 | 2675 |
| Other use | GWh | 1516 | 1561 | 1597 | 1718 | 1641 | 2028 | 2059 | 2151 | 2166 | 2348 |
| Total | GWh | 8727 | 8750 | 9285 | 9384 | 9414 | 9782 | 10040 | 10213 | 10522 | 10927 |
| 2002 | 2003 | 2004 | 2005 | 2006 | 2007 | 2008 | 2009 | 2010 | 2011 | ||
| Manufacturing and construction | GWh | 5790 | 6543 | 6710 | 7172 | 7440 | 7468 | 6311 | 4966 | 5487 | 5864 |
| Transport | GWh | 172 | 179 | 189 | 197 | 198 | 195 | 196 | 156 | 173 | 164 |
| Households | GWh | 2704 | 3008 | 3012 | 2951 | 3055 | 3021 | 3182 | 3137 | 3219 | 3211 |
| Other use | GWh | 3023 | 2335 | 2637 | 2423 | 2472 | 2579 | 3117 | 3033 | 3087 | 3368 |
| Total | GWh | 11689 | 12065 | 12548 | 12743 | 13165 | 13263 | 12806 | 11292 | 11966 | 12607 |
Statistical Office of the Republic of Slovenia, 2012; Eurostat, 2012.
| 1992 | 2000 | 2011 | ||
|---|---|---|---|---|
| Manufacturing and construction | GWh | 4660 | 5490 | 5864 |
| Transport | GWh | 147 | 265 | 164 |
| Households | GWh | 2404 | 2601 | 3211 |
| Other use | GWh | 1516 | 2166 | 3368 |
| Total | GWh | 8727 | 10522 | 12607 |
| Manufacturing and construction | % | 53.4 | 52.2 | 46.5 |
| Transport | % | 1.7 | 2.5 | 1.3 |
| Households | % | 27.5 | 24.7 | 25.5 |
| Other use | % | 17.4 | 20.6 | 26.7 |
Statistical Office of the Republic of Slovenia, 2012; Eurostat, 2012.
| 1992 | 1993 | 1994 | 1995 | 1996 | 1997 | 1998 | 1999 | 2000 | 2001 | ||
|---|---|---|---|---|---|---|---|---|---|---|---|
| Manufacturing and construction | GWh | 4660 | 4553 | 4956 | 4943 | 4921 | 4853 | 5055 | 5099 | 5490 | 5648 |
| Transport | GWh | 147 | 146 | 147 | 170 | 258 | 264 | 268 | 271 | 265 | 256 |
| Households | GWh | 2404 | 2490 | 2585 | 2553 | 2594 | 2637 | 2658 | 2692 | 2601 | 2675 |
| Other use | GWh | 1516 | 1561 | 1597 | 1718 | 1641 | 2028 | 2059 | 2151 | 2166 | 2348 |
| Total | GWh | 8727 | 8750 | 9285 | 9384 | 9414 | 9782 | 10040 | 10213 | 10522 | 10927 |
| Manufacturing and construction | index (1992 = 100) | 100 | 98 | 106 | 106 | 106 | 104 | 108 | 109 | 118 | 121 |
| Transport | index (1992 = 100) | 100 | 99 | 100 | 116 | 176 | 180 | 182 | 184 | 180 | 174 |
| Households | index (1992 = 100) | 100 | 104 | 108 | 106 | 108 | 110 | 111 | 112 | 108 | 111 |
| Other use | index (1992 = 100) | 100 | 103 | 105 | 113 | 108 | 134 | 136 | 142 | 143 | 155 |
| Total | index (1992 = 100) | 100 | 100 | 106 | 108 | 108 | 112 | 115 | 117 | 121 | 125 |
| 2002 | 2003 | 2004 | 2005 | 2006 | 2007 | 2008 | 2009 | 2010 | 2011 | ||
| Manufacturing and construction | GWh | 5790 | 6543 | 6710 | 7172 | 7440 | 7468 | 6311 | 4966 | 5487 | 5864 |
| Transport | GWh | 172 | 179 | 189 | 197 | 198 | 195 | 196 | 156 | 173 | 164 |
| Households | GWh | 2704 | 3008 | 3012 | 2951 | 3055 | 3021 | 3182 | 3137 | 3219 | 3211 |
| Other use | GWh | 3023 | 2335 | 2637 | 2423 | 2472 | 2579 | 3117 | 3033 | 3087 | 3368 |
| Total | GWh | 11689 | 12065 | 12548 | 12743 | 13165 | 13263 | 12806 | 11292 | 11966 | 12607 |
| Manufacturing and construction | index (1992 = 100) | 124 | 140 | 144 | 154 | 160 | 160 | 135 | 107 | 118 | 126 |
| Transport | index (1992 = 100) | 117 | 122 | 129 | 134 | 135 | 133 | 133 | 106 | 118 | 112 |
| Households | index (1992 = 100) | 112 | 125 | 125 | 123 | 127 | 126 | 132 | 130 | 134 | 134 |
| Other use | index (1992 = 100) | 199 | 154 | 174 | 160 | 163 | 170 | 206 | 200 | 204 | 222 |
| Total | index (1992 = 100) | 134 | 138 | 144 | 146 | 151 | 152 | 147 | 129 | 137 | 144 |
Statistical Office of the Republic of Slovenia, 2012; Eurostat, 2012.
| Manufacturing and construction | Transport | Households | Other use | Total | ||
|---|---|---|---|---|---|---|
| 1992 - 2011 | % | 1.2 | 0.6 | 1.5 | 4.3 | 2 |
| 2000 - 2011 | % | 0.6 | -4.3 | 1.9 | 4.1 | 1.7 |
| 2009 - 2010 | % | 10.5 | 10.9 | 2.6 | 1.8 | 6 |
| 2010 - 2011 | % | 6.9 | -5.2 | -0.2 | 9.1 | 5.4 |
Eurostat, 2012.
| EU-27 | EU-25 | EU-15 | EU-10 | - | Cyprus | Latvia | Spain | Estonia | Lithuania | ||
|---|---|---|---|---|---|---|---|---|---|---|---|
| 2000 | TWh | 2518.9 | 2460.7 | 2230.5 | 230.2 | 3 | 4.5 | 188.5 | 5 | 6.2 | |
| 2001 | TWh | 2583.3 | 2522.4 | 2287 | 235.5 | 3.1 | 4.6 | 201 | 5.2 | 6.4 | |
| 2002 | TWh | 2610.5 | 2550.8 | 2314.5 | 236.3 | 3.4 | 4.9 | 205.5 | 5.4 | 6.7 | |
| 2003 | TWh | 2672.4 | 2609.8 | 2366.3 | 243.5 | 3.6 | 5.2 | 217.9 | 5.7 | 7.2 | |
| 2004 | TWh | 2732.5 | 2668.8 | 2417.4 | 251.4 | 3.7 | 5.4 | 230.7 | 5.9 | 7.7 | |
| 2005 | TWh | 2770 | 2705.4 | 2451.1 | 254.3 | 4 | 5.7 | 242.2 | 6 | 8 | |
| 2006 | TWh | 2829.2 | 2761.3 | 2496.1 | 265.2 | 4.2 | 6.1 | 256.5 | 6.5 | 8.4 | |
| 2007 | TWh | 2848.3 | 2780.2 | 2508.3 | 271.8 | 4.4 | 6.6 | 262.2 | 6.8 | 8.9 | |
| 2000-2010 | % | 1.2 | 1.2 | 1.1 | 1.8 | 5 | 3.3 | 3.3 | 3.3 | 3 | |
| 2009-2010 | % | 4.6 | 4.6 | 4.6 | 4.3 | 2.9 | 1.8 | 3 | 3.7 | -0.5 | |
| Portugal | Ireland | Greece | Romania | Poland | Austria | Hungary | Czech Republic | France | Luxembourg (Grand-Duché) | ||
| 2000 | TWh | 38.4 | 20.3 | 43.2 | 33.9 | 98.6 | 51.5 | 29.4 | 49.4 | 384.9 | 5.8 |
| 2001 | TWh | 39.9 | 21 | 44.5 | 36.3 | 98.8 | 53.6 | 30.5 | 50.9 | 395.8 | 5.8 |
| 2002 | TWh | 41.5 | 21.8 | 46.6 | 35.6 | 97.5 | 53.9 | 31.5 | 50.8 | 393.5 | 5.9 |
| 2003 | TWh | 43.2 | 23 | 48.6 | 37.5 | 101.2 | 55.6 | 31.4 | 52.4 | 408.4 | 6.2 |
| 2004 | TWh | 44.7 | 23.1 | 49.7 | 38.8 | 104.7 | 56.8 | 31.8 | 53.8 | 420.2 | 6.4 |
| 2005 | TWh | 46.3 | 24.4 | 50.9 | 38.9 | 105.4 | 58.3 | 32.3 | 55.3 | 422.8 | 6.2 |
| 2006 | TWh | 47.8 | 25.9 | 52.5 | 41 | 111.1 | 60.9 | 33.2 | 57 | 426.9 | 6.6 |
| 2007 | TWh | 49 | 25.9 | 55.2 | 41 | 114.5 | 62 | 33.7 | 57.2 | 426 | 6.7 |
| 2000-2010 | % | 2.7 | 2.2 | 2.1 | 2 | 1.8 | 1.8 | 1.5 | 1.5 | 1.4 | 1.3 |
| 2009-2010 | % | 4.2 | 0.7 | -2.9 | 9.9 | 5.1 | 4 | 3.2 | 4.2 | 6.3 | 8 |
| Slovenia | Bulgaria | Finland | Italy | Slovakia | Germany (including ex-GDR from 1991) | Netherlands | Belgium | Malta | Sweden | ||
| 2000 | TWh | 10.5 | 24.3 | 75.7 | 273 | 22 | 483.5 | 97.8 | 77.5 | 1.6 | 128.7 |
| 2001 | TWh | 10.9 | 24.6 | 77.4 | 277.7 | 23.5 | 495.3 | 99.2 | 78.1 | 1.6 | 132.3 |
| 2002 | TWh | 11.7 | 24.1 | 79.7 | 282.8 | 22.8 | 508.5 | 99.7 | 78.4 | 1.7 | 130.9 |
| 2003 | TWh | 12 | 25.1 | 80.9 | 291.4 | 23 | 512.9 | 100.4 | 79.7 | 1.8 | 129.4 |
| 2004 | TWh | 12.5 | 24.9 | 83.1 | 295.5 | 24 | 519.7 | 104.7 | 80.6 | 1.8 | 130.4 |
| 2005 | TWh | 12.7 | 25.7 | 80.7 | 300.9 | 22.9 | 521 | 104.5 | 80.2 | 2 | 130.7 |
| 2006 | TWh | 13.2 | 26.9 | 86 | 308.8 | 23.7 | 525.8 | 106 | 82.6 | 1.9 | 130.8 |
| 2007 | TWh | 13.3 | 27.2 | 86.1 | 309.3 | 24.6 | 527.4 | 108.5 | 82.9 | 1.9 | 131.1 |
| 2000-2010 | % | 1.3 | 1.1 | 1 | 0.9 | 0.9 | 0.9 | 0.9 | 0.7 | 0.2 | 0.2 |
| 2009-2010 | % | 6 | 1 | 8.3 | 3.2 | 4.4 | 6.7 | 2.8 | 7.8 | -5.9 | 6.4 |
| United Kingdom | Denmark | ||||||||||
| 2000 | TWh | 329.4 | 32.5 | ||||||||
| 2001 | TWh | 332.7 | 32.6 | ||||||||
| 2002 | TWh | 333.4 | 32.5 | ||||||||
| 2003 | TWh | 336.2 | 32.4 | ||||||||
| 2004 | TWh | 338.9 | 33 | ||||||||
| 2005 | TWh | 348.7 | 33.5 | ||||||||
| 2006 | TWh | 345.2 | 33.8 | ||||||||
| 2007 | TWh | 342.7 | 33.5 | ||||||||
| 2000-2010 | % | -0 | -0.1 | ||||||||
| 2009-2010 | % | 1.7 | 2.1 |
Eurostat, 2012.
| EU-27 | EU-25 | EU-15 | EU-10 | - | Finland | Sweden | Luxembourg (Grand-Duché) | Belgium | Austria | ||
|---|---|---|---|---|---|---|---|---|---|---|---|
| 2000 | MWh/capita | 5.2 | 5.4 | 5.9 | 3.1 | 14.6 | 14.5 | 13.2 | 7.6 | 6.4 | |
| 2001 | MWh/capita | 5.3 | 5.5 | 6 | 3.2 | 14.9 | 14.8 | 13.2 | 7.6 | 6.6 | |
| 2002 | MWh/capita | 5.4 | 5.6 | 6 | 3.2 | 15.3 | 14.6 | 13.2 | 7.6 | 6.6 | |
| 2003 | MWh/capita | 5.5 | 5.7 | 6.1 | 3.3 | 15.5 | 14.4 | 13.6 | 7.7 | 6.8 | |
| 2004 | MWh/capita | 5.6 | 5.8 | 6.2 | 3.4 | 15.9 | 14.5 | 13.9 | 7.7 | 6.9 | |
| 2005 | MWh/capita | 5.6 | 5.8 | 6.3 | 3.4 | 15.4 | 14.4 | 13.1 | 7.6 | 7.1 | |
| 2006 | MWh/capita | 5.7 | 5.9 | 6.4 | 3.6 | 16.3 | 14.4 | 13.9 | 7.8 | 7.4 | |
| 2007 | MWh/capita | 5.7 | 5.9 | 6.4 | 3.7 | 16.2 | 14.3 | 13.8 | 7.8 | 7.5 | |
| 2008 | MWh/capita | 5.7 | 5.9 | 6.3 | 3.7 | 15.5 | 13.9 | 13.4 | 7.7 | 7.3 | |
| 2009 | MWh/capita | 5.4 | 5.6 | 6 | 3.5 | 14.4 | 13.2 | 12.2 | 7.1 | 7 | |
| 2010 | MWh/capita | 5.6 | 5.8 | 6.2 | 3.7 | 15.5 | 13.9 | 12.9 | 7.6 | 7.3 | |
| France | Germany (including ex-GDR from 1991) | Netherlands | Cyprus | Slovenia | Denmark | Spain | Ireland | Czech Republic | United Kingdom | ||
| 2000 | MWh/capita | 6.3 | 5.9 | 6.1 | 4.3 | 5.3 | 6.1 | 4.7 | 5.3 | 4.8 | 5.6 |
| 2001 | MWh/capita | 6.4 | 6 | 6.2 | 4.4 | 5.5 | 6.1 | 4.9 | 5.4 | 5 | 5.6 |
| 2002 | MWh/capita | 6.4 | 6.2 | 6.2 | 4.7 | 5.9 | 6 | 4.9 | 5.5 | 5 | 5.6 |
| 2003 | MWh/capita | 6.6 | 6.2 | 6.2 | 5 | 6 | 6 | 5.1 | 5.7 | 5.1 | 5.6 |
| 2004 | MWh/capita | 6.7 | 6.3 | 6.4 | 5 | 6.3 | 6.1 | 5.4 | 5.6 | 5.3 | 5.6 |
| 2005 | MWh/capita | 6.7 | 6.3 | 6.4 | 5.2 | 6.4 | 6.2 | 5.5 | 5.8 | 5.4 | 5.8 |
| 2006 | MWh/capita | 6.7 | 6.4 | 6.5 | 5.4 | 6.5 | 6.2 | 5.8 | 6 | 5.5 | 5.7 |
| 2007 | MWh/capita | 6.7 | 6.4 | 6.6 | 5.6 | 6.6 | 6.1 | 5.8 | 5.9 | 5.5 | 5.6 |
| 2008 | MWh/capita | 6.7 | 6.4 | 6.6 | 5.8 | 6.3 | 6 | 5.9 | 6 | 5.5 | 5.6 |
| 2009 | MWh/capita | 6.5 | 6.1 | 6.3 | 5.9 | 5.5 | 5.7 | 5.5 | 5.6 | 5.2 | 5.2 |
| 2010 | MWh/capita | 6.8 | 6.5 | 6.4 | 6.1 | 5.8 | 5.8 | 5.6 | 5.6 | 5.4 | 5.3 |
| Estonia | Italy | Greece | Portugal | Slovakia | Malta | Bulgaria | Hungary | Poland | Latvia | ||
| 2000 | MWh/capita | 3.7 | 4.8 | 3.9 | 3.7 | 4.1 | 4 | 3 | 2.9 | 2.6 | 1.9 |
| 2001 | MWh/capita | 3.8 | 4.9 | 4.1 | 3.9 | 4.4 | 4 | 3.1 | 3 | 2.6 | 2 |
| 2002 | MWh/capita | 4 | 4.9 | 4.2 | 4 | 4.2 | 4.2 | 3.1 | 3.1 | 2.6 | 2.1 |
| 2003 | MWh/capita | 4.2 | 5 | 4.4 | 4.1 | 4.3 | 4.5 | 3.2 | 3.1 | 2.6 | 2.2 |
| 2004 | MWh/capita | 4.4 | 5.1 | 4.5 | 4.2 | 4.5 | 4.4 | 3.2 | 3.2 | 2.7 | 2.3 |
| 2005 | MWh/capita | 4.5 | 5.1 | 4.6 | 4.4 | 4.2 | 4.8 | 3.3 | 3.2 | 2.8 | 2.5 |
| 2006 | MWh/capita | 4.8 | 5.2 | 4.7 | 4.5 | 4.4 | 4.5 | 3.5 | 3.3 | 2.9 | 2.7 |
| 2007 | MWh/capita | 5.1 | 5.2 | 4.9 | 4.6 | 4.5 | 4.5 | 3.6 | 3.4 | 3 | 2.9 |
| 2008 | MWh/capita | 5.2 | 5.2 | 5 | 4.5 | 4.6 | 4.5 | 3.8 | 3.4 | 3.1 | 2.9 |
| 2009 | MWh/capita | 5 | 4.8 | 4.8 | 4.5 | 4.3 | 4.1 | 3.5 | 3.3 | 3 | 2.7 |
| 2010 | MWh/capita | 5.1 | 4.9 | 4.7 | 4.7 | 4.4 | 3.8 | 3.6 | 3.4 | 3.1 | 2.8 |
| Lithuania | Romania | ||||||||||
| 2000 | MWh/capita | 1.8 | 1.5 | ||||||||
| 2001 | MWh/capita | 1.9 | 1.7 | ||||||||
| 2002 | MWh/capita | 1.9 | 1.6 | ||||||||
| 2003 | MWh/capita | 2.1 | 1.7 | ||||||||
| 2004 | MWh/capita | 2.2 | 1.8 | ||||||||
| 2005 | MWh/capita | 2.3 | 1.8 | ||||||||
| 2006 | MWh/capita | 2.5 | 1.9 | ||||||||
| 2007 | MWh/capita | 2.6 | 1.9 | ||||||||
| 2008 | MWh/capita | 2.7 | 1.9 | ||||||||
| 2009 | MWh/capita | 2.5 | 1.8 | ||||||||
| 2010 | MWh/capita | 2.6 | 1.9 |


