[EN09] Emissions of air pollutants from energy sources

Key message

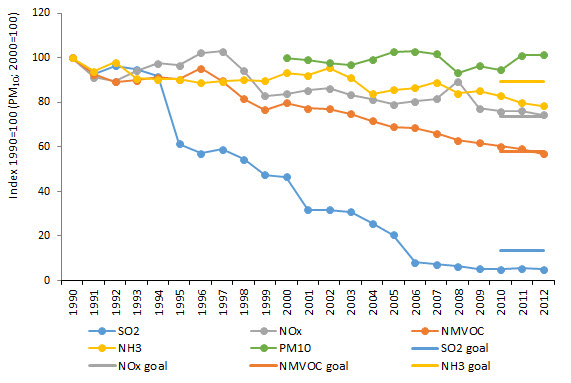
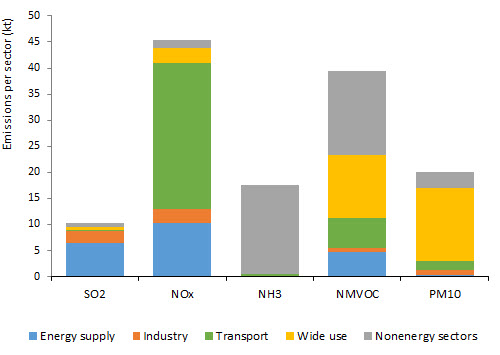
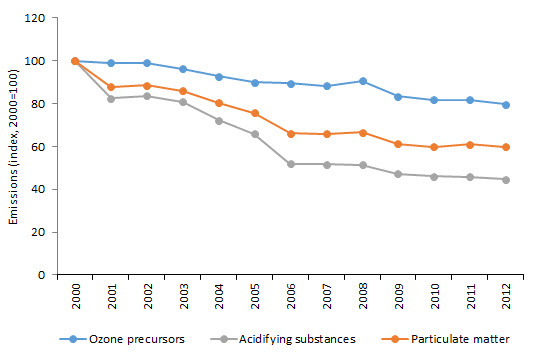
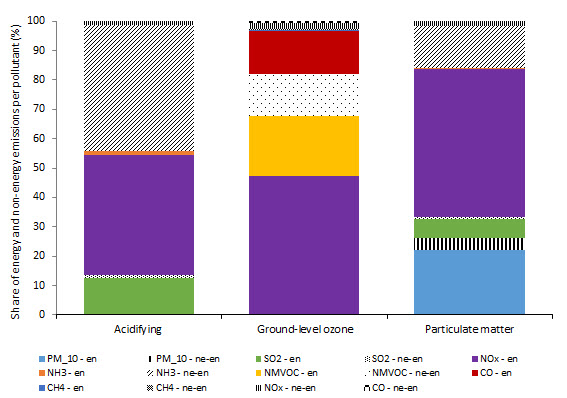
SO2 and NMVOC emissions from energy sector in Slovenia decreased in period 1990-2012. Emissions of NOx and NH3 have not decreased as much as SO2 and NMVOC in the same time period. Emissions of PM10 slightly increased between 1990 and 2012. This resulted in reduction of emissions of substances that cause acidification, ozone precursors and particulate matter. NOx is the only substance with a significant proportion of emissions in transport and in production of electricity and heat.
In 2012, NOx emissions exceed the target value, while emissions of SO2, NMVOC and NH3 were lower than the prescribed target value. To achieve the 2020 goals implementation of measures to reduce emissions of NOx and PM2.5 will be needed.
Definition
Charts
National Emission Database, Slovenian Environment Agency, 2014
| 1990 | 1991 | 1992 | 1993 | 1994 | 1995 | 1996 | 1997 | 1998 | 1999 | ||
|---|---|---|---|---|---|---|---|---|---|---|---|
| SO2 | index (1990 = 100) | 100 | 92.889 | 96.532 | 94.969 | 91.739 | 61.468 | 57.206 | 59 | 54.482 | 47.537 |
| NOx | index (1990 = 100) | 100 | 91.258 | 89.515 | 94.226 | 97.58 | 96.725 | 102.343 | 103.036 | 94.15 | 82.969 |
| NMVOC | index (1990 = 100) | 100 | 92.693 | 89.272 | 89.978 | 91.206 | 90.37 | 95.451 | 89.718 | 81.739 | 76.771 |
| NH3 | index (1990 = 100) | 100 | 94.04 | 98.016 | 90.764 | 90.434 | 90.345 | 88.804 | 89.496 | 90.209 | 89.829 |
| PM10 | index (2000 = 100) | ||||||||||
| SO2 goal | index (1990 = 100) | ||||||||||
| NOx goal | index (1990 = 100) | ||||||||||
| NMVOC goal | index (1990 = 100) | ||||||||||
| NH3 goal | index (1990 = 100) | ||||||||||
| 2000 | 2001 | 2002 | 2003 | 2004 | 2005 | 2006 | 2007 | 2008 | 2009 | ||
| SO2 | index (1990 = 100) | 46.624 | 31.724 | 31.795 | 30.987 | 25.663 | 20.524 | 8.295 | 7.349 | 6.446 | 5.28 |
| NOx | index (1990 = 100) | 83.942 | 85.433 | 86.373 | 83.346 | 81.511 | 79.221 | 80.63 | 81.56 | 89.406 | 77.408 |
| NMVOC | index (1990 = 100) | 79.815 | 77.364 | 77.134 | 74.906 | 71.784 | 69.096 | 68.54 | 66.12 | 63.102 | 61.825 |
| NH3 | index (1990 = 100) | 93.213 | 92.279 | 95.657 | 91.063 | 83.911 | 85.611 | 86.501 | 89.133 | 84.052 | 85.207 |
| PM10 | index (2000 = 100) | 100 | 99.101 | 97.83 | 96.924 | 99.273 | 102.655 | 102.969 | 101.889 | 93.271 | 96.523 |
| SO2 goal | index (1990 = 100) | ||||||||||
| NOx goal | index (1990 = 100) | ||||||||||
| NMVOC goal | index (1990 = 100) | ||||||||||
| NH3 goal | index (1990 = 100) | ||||||||||
| 2010 | 2011 | 2012 | |||||||||
| SO2 | index (1990 = 100) | 4.962 | 5.513 | 5.124 | |||||||
| NOx | index (1990 = 100) | 76.065 | 76.284 | 74.369 | |||||||
| NMVOC | index (1990 = 100) | 60.296 | 59.119 | 57.036 | |||||||
| NH3 | index (1990 = 100) | 82.915 | 79.857 | 78.592 | |||||||
| PM10 | index (2000 = 100) | 94.754 | 101.176 | 101.5 | |||||||
| SO2 goal | index (1990 = 100) | 13.586 | 13.586 | 13.586 | |||||||
| NOx goal | index (1990 = 100) | 73.75 | 73.75 | 73.75 | |||||||
| NMVOC goal | index (1990 = 100) | 57.737 | 57.737 | 57.737 | |||||||
| NH3 goal | index (1990 = 100) | 89.614 | 89.614 | 89.614 |
National Emission Database, Slovenian Environment Agency, 2014
| SO2 | NOx | NH3 | NMVOC | PM10 | ||
|---|---|---|---|---|---|---|
| Energy supply | kt | 6.51 | 10.35 | 0 | 4.66 | 0.37 |
| Industry | kt | 2.27 | 2.69 | 0 | 0.86 | 0.79 |
| Transport | kt | 0.06 | 27.84 | 0.51 | 5.67 | 1.9 |
| Wide use | kt | 0.57 | 2.98 | 0 | 12.1 | 13.87 |
| Nonenergy sectors | kt | 0.77 | 1.51 | 17.03 | 16.23 | 3.03 |
| TOTAL | kt | 10.18 | 45.38 | 17.54 | 39.51 | 19.97 |
National Emission Database, Slovenian Environment Agency, 2014
| 1990 | 1991 | 1992 | 1993 | 1994 | 1995 | 1996 | 1997 | 1998 | 1999 | ||
|---|---|---|---|---|---|---|---|---|---|---|---|
| Ozone precursors | Index (2000 = 100) | ||||||||||
| Acidifying substances | Index (2000 = 100) | ||||||||||
| Particulate matter | Index (2000 = 100) | ||||||||||
| Ozone precursors | kt NMVOC equivalents | 182.1 | 169.3 | 162.3 | 167.8 | 170.4 | 169.1 | 178.1 | 171.5 | 155 | 140.3 |
| Acidifying substances | kt acid equivalents | 8.8 | 8.2 | 8.5 | 8.3 | 8.2 | 6.3 | 6.1 | 6.2 | 5.8 | 5.2 |
| Particulate matter | kt PM10 equivalents | ||||||||||
| 2000 | 2001 | 2002 | 2003 | 2004 | 2005 | 2006 | 2007 | 2008 | 2009 | ||
| Ozone precursors | Index (2000 = 100) | 100 | 99.1 | 99 | 96.1 | 92.7 | 89.9 | 89.5 | 88.2 | 90.5 | 83.4 |
| Acidifying substances | Index (2000 = 100) | 100 | 82.5 | 83.6 | 80.8 | 72.2 | 65.9 | 52 | 51.8 | 51.4 | 47.3 |
| Particulate matter | Index (2000 = 100) | 100 | 87.9 | 88.5 | 85.9 | 80.3 | 75.7 | 66.2 | 65.9 | 66.6 | 61.2 |
| Ozone precursors | kt NMVOC equivalents | 142.7 | 141.3 | 141.3 | 137.2 | 132.2 | 128.2 | 127.7 | 125.9 | 129.1 | 118.9 |
| Acidifying substances | kt acid equivalents | 5.2 | 4.3 | 4.4 | 4.2 | 3.8 | 3.4 | 2.7 | 2.7 | 2.7 | 2.5 |
| Particulate matter | kt PM10 equivalents | 128.1 | 112.6 | 113.4 | 110.1 | 102.8 | 97 | 84.8 | 84.5 | 85.3 | 78.4 |
| 2010 | 2011 | 2012 | |||||||||
| Ozone precursors | Index (2000 = 100) | 81.6 | 81.7 | 79.6 | |||||||
| Acidifying substances | Index (2000 = 100) | 46 | 45.9 | 44.7 | |||||||
| Particulate matter | Index (2000 = 100) | 59.8 | 61 | 59.8 | |||||||
| Ozone precursors | kt NMVOC equivalents | 116.5 | 116.6 | 113.6 | |||||||
| Acidifying substances | kt acid equivalents | 2.4 | 2.4 | 2.3 | |||||||
| Particulate matter | kt PM10 equivalents | 76.7 | 78.2 | 76.6 |
National Emission Database, National Greenhouse Gas Emissions, Slovenian Environment Agency, 2014
| Acidifying | Ground-level ozone | Particulate matter | ||
|---|---|---|---|---|
| PM_10 - en | kt | 0 | 0 | 16.94 |
| PM_10 - non-en | kt | 0 | 0 | 3.03 |
| SO2 - en | kt | 0.29 | 0 | 5.08 |
| SO2 - non-en | kt | 0.02 | 0 | 0.42 |
| NOx - en | kt | 0.95 | 53.51 | 38.6 |
| NOx - non-en | kt | 0.03 | 1.85 | 1.33 |
| NH3 - en | kt | 0.03 | 0.33 | |
| NH3 - non-en | kt | 1 | 10.9 | |
| NMVOC - en | kt | 0 | 23.29 | 0 |
| NMVOC - non-en | kt | 0 | 16.23 | 0 |
| CO - en | kt | 0 | 16.71 | 0 |
| CO - non-en | kt | 0 | 0.74 | 0 |
| CH4 - en | kt | 0 | 0.27 | 0 |
| CH4 - non-en | kt | 0 | 0.98 | 0 |
| TOTAL | kt | 2.34 | 113.57 | 76.63 |
| PM_10 - en | % | 0 | 0 | 22.11 |
| PM_10 - non-en | % | 0 | 0 | 3.95 |
| SO2 - en | % | 12.59 | 0 | 6.63 |
| SO2 - non-en | % | 1.03 | 0 | 0.54 |
| NOx - en | % | 40.81 | 47.12 | 50.37 |
| NOx - ne-en | % | 1.41 | 1.63 | 1.74 |
| NH3 - en | % | 1.29 | 0 | 0.43 |
| NH3 - non-en | % | 42.87 | 0 | 14.22 |
| NMVOC - en | % | 0 | 20.51 | 0 |
| NMVOC - non-en | % | 0 | 14.29 | 0 |
| CO - en | % | 0 | 14.72 | 0 |
| CO - ne-en | % | 0 | 0.65 | 0 |
| CH4 - en | % | 0 | 0.24 | 0 |
| CH4 - non-en | % | 0 | 0.86 | 0 |
| TOTAL | % | 100 | 100 | 100 |
National Emission Database, National Greenhouse Gas Emissions Database, Slovenian Environment Agency, 2014
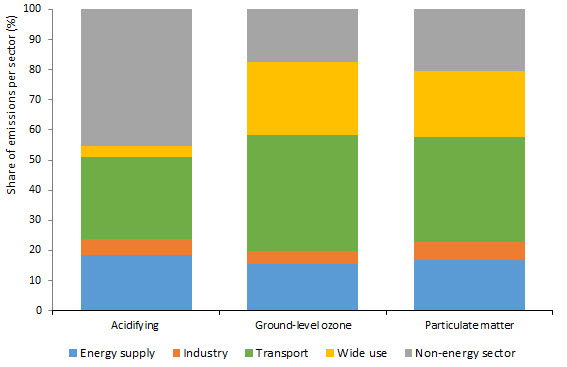
| Acidifying | Ground-level ozone | Particulate matter | ||
|---|---|---|---|---|
| Energy supply | kt | 0.43 | 17.68 | 13 |
| Industry | kt | 0.13 | 4.95 | 4.39 |
| Transport | kt | 0.64 | 43.73 | 26.76 |
| Wide use | kt | 0.08 | 27.43 | 16.81 |
| Non-energy sector | kt | 1.06 | 19.79 | 15.68 |
| TOTAL | kt | 2.34 | 113.57 | 76.63 |
| TOTAL - ENERGY SECTOR | kt | 1.28 | 93.79 | 60.95 |
| Energy supply | % | 18.34 | 15.57 | 16.96 |
| Industry | % | 5.54 | 4.35 | 5.73 |
| Transport | % | 27.27 | 38.5 | 34.92 |
| Wide use | % | 3.54 | 24.15 | 21.93 |
| Non-energy sector | % | 45.31 | 17.42 | 20.46 |
| TOTAL | % | 100 | 100 | 100 |
| TOTAL - ENERGY SECTOR | % | 54.69 | 82.58 | 79.54 |
National Emission Database, National Greenhouse Gas Emission Database, Slovenian Environment Agency, 2014
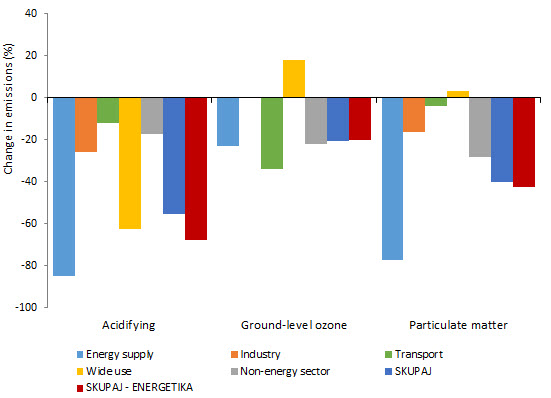
| Acidifying | Ground-level ozone | Particulate matter | ||
|---|---|---|---|---|
| Energy supply | % | -84.9 | -22.8 | -77.2 |
| Industry | % | -25.9 | 0.5 | -16.4 |
| Transport | % | -11.9 | -34 | -3.9 |
| Wide use | % | -62.7 | 17.9 | 3.1 |
| Non-energy sector | % | -17.2 | -21.9 | -28.1 |
| TOTAL | % | -55.3 | -20.4 | -40.2 |
| TOTAL - ENERGY SECTOR | % | -67.7 | -20.1 | -42.7 |
| Energy supply | kt | 2.8 | 22.9 | 56.9 |
| Industry | kt | 0.2 | 4.9 | 5.3 |
| Transport | kt | 0.7 | 66.2 | 27.8 |
| Wide use | kt | 0.2 | 23.3 | 16.3 |
| Non-energy sector | kt | 1.3 | 25.3 | 21.8 |
| TOTAL | kt | 5.2 | 142.7 | 128.1 |
| TOTAL - ENERGY SECTOR | kt | 4 | 117.3 | 106.3 |
| Energy supply | kt | 0.4 | 17.7 | 13 |
| Industry | kt | 0.1 | 4.9 | 4.4 |
| Transport | kt | 0.6 | 43.7 | 26.8 |
| Wide use | kt | 0.1 | 27.4 | 16.8 |
| Non-energy sector | kt | 1.1 | 19.8 | 15.7 |
| TOTAL | kt | 2.3 | 113.6 | 76.6 |
| TOTAL - ENERGY SECTOR | kt | 1.3 | 93.8 | 61 |


