-
-
-
-
-
-
-
-
Tools and collections
- Environmental atlas
- EIONET in Slovenia
- Environmental indicators
- IED devices
- Endangered species
- IS-waste

-
-
Tools and collections
- Environmental atlas
- EIONET in Slovenia
- Environmental indicators
- IED devices
- Endangered species
- IS-waste

[PR13] Use of alternative fuels in transport

Key message

The introduction of biofuels in Slovenia and the objectives in this area are lagging behind the referential values of the EU Directive on the promotion of the use of biofuels and other renewable fuels for transport. Slovenia explains the deviations from the referential values by the limited possibilities of biofuel production, the discrepancies between the prices of mineral fuels and biofuels, and thus the non-stimulating market conditions that do not promote consumer to use biofuels.
Definition
Charts
Report of the Government of the RS, 2005-2013. Measures to promote the use of biofuels, the total stock of fuel for transport and the share of biofuels, the Ministry of Agriculture and the Environment.
| 2005 | 2006 | 2007 | 2008 | 2009 | 2010 | 2011 | 2012 | 2013 | ||
|---|---|---|---|---|---|---|---|---|---|---|
| area sown with oilseed rape | ha | 2260 | 2809 | 5358 | 4442 | 4424 | 5303 | 4770 | 5141 | 6131 |
| production of biodiesel from its own raw materials | t | 1784 | 1664 | 4913 | 3650 | 3282 | 5174 | 4650 | 5564 | 0 |
| production of biodiesel from its own and imported raw materials | t | 6000 | 8300 | 7300 | 7300 | 7252 | 20561 | 649 | 1059 | 2 |
Reportof the Government of the RS, 2005-2013. Measures to promote the use of biofuels, the total stock of fuel for transport and the share of biofuels, the Ministry of Agriculture and the Environment.
| 2005 | 2006 | 2007 | 2008 | 2009 | 2010 | 2011 | 2012 | 2013 | ||
|---|---|---|---|---|---|---|---|---|---|---|
| biodiesel in diesel | amount (t) | 5371 | 4642 | 14757 | 24814 | 29288 | 44841 | 35012 | 51341 | 56446 |
| pure biodiesel | amount (t) | 437 | 2388 | 2627 | 768 | 1092 | 1662 | |||
| bioethanol in petrol | amount (t) | 272 | 1247 | 3706 | 2882 | 4506 | 5805 | 8203 | 8664 | |
| mass share | % | 1 | 0 | 1 | 1 | 2 | 3 | 2 | 3 | 4 |
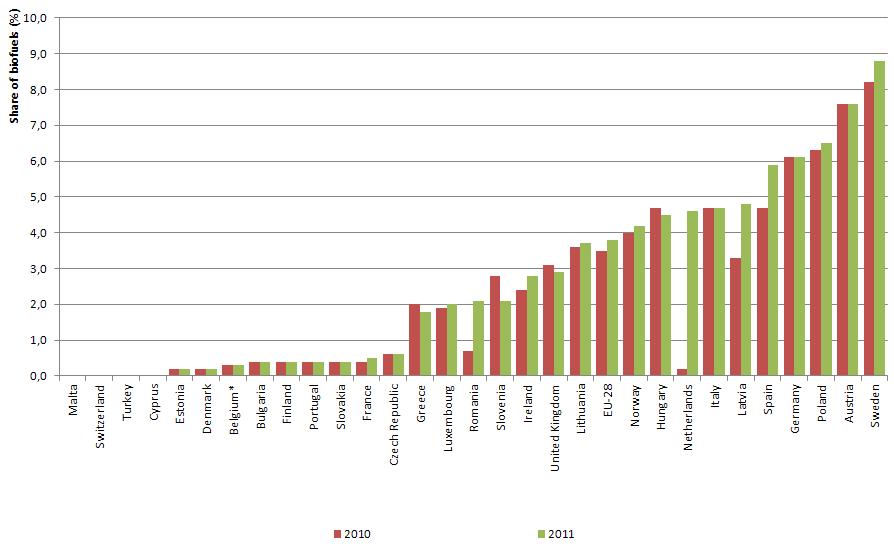
CSI 037/TERM 031 - Use of cleaner and alternative fuels, 2013*Note to Figure PR13-3:Data for Belgium is estimated.
| Estonia | Malta | Norway | Iceland | Denmark | Latvia | Bulgaria | Switzerland | Turkey | Greece | ||
|---|---|---|---|---|---|---|---|---|---|---|---|
| 1995 | % | 0 | 0 | 0 | 0 | 0 | 0 | 0 | 0 | 0 | 0 |
| 2000 | % | 0 | 0 | 0 | 0 | 0 | 0 | 0 | 0 | 0 | 0 |
| 2008 | % | 1 | 0 | 0 | 0 | 0 | 0 | 0 | 0 | 1 | 1 |
| 2009 | % | 0 | 0 | 0 | 0 | 0 | 0 | 9 | 0 | 0 | 0 |
| 2010 | % | 2 | 0 | 0 | 0 | 0 | 3 | 0 | 0 | 0 | 0 |
| Slovenia* | Belgium | Ireland | Luxembourg | Spain | Finland | Czech Republic | United Kingdom | Italy | Cyprus | ||
| 1995 | % | 0 | 0 | 0 | 0 | 0 | 0 | 0 | 0 | 0 | 0 |
| 2000 | % | 0 | 0 | 0 | 0 | 0 | 0 | 2 | 0 | 0 | 0 |
| 2008 | % | 1 | 1 | 1 | 2 | 2 | 2 | 2 | 2 | 2 | 2 |
| 2009 | % | 2 | 0 | 2 | 0 | 4 | 0 | 3 | 2 | 3 | 0 |
| 2010 | % | 3 | 0 | 0 | 0 | 4 | 0 | 0 | 3 | 0 | 0 |
| Portugal | Romania | Netherlands | EEA | EU-27 | Poland | EU-15 | Hungary | Lithuania | Sweden | ||
| 1995 | % | 0 | 0 | 0 | 0 | 0 | 0 | 0 | 0 | 0 | 0 |
| 2000 | % | 0 | 0 | 0 | 0 | 0 | 0 | 0 | 0 | 0 | 0 |
| 2008 | % | 2 | 2 | 3 | 3 | 3 | 3 | 3 | 4 | 4 | 5 |
| 2009 | % | 4 | 4 | 4 | 0 | 0 | 5 | 0 | 4 | 6 | 0 |
| 2010 | % | 0 | 0 | 4 | 0 | 0 | 0 | 0 | 0 | 4 | 0 |
| France | Austria | Germany | Slovakia | ||||||||
| 1995 | % | 0 | 0 | 0 | 0 | ||||||
| 2000 | % | 1 | 0 | 0 | 0 | ||||||
| 2008 | % | 6 | 6 | 6 | 7 | ||||||
| 2009 | % | 6 | 7 | 6 | 3 | ||||||
| 2010 | % | 0 | 7 | 6 | 4 |
Mirko Bizjak, Slovenian Environment Agency


