[PG13] Food consumption – animal based protein

Key message

Slovenians are big meat lovers. Data for 2021 show that we eat a lot of meat (all types of meat are included here), 89.28 kg per capita; the European average is 69.3 kg. We are also big consumers of eggs, with which we are almost self-sufficient, while fish consumption is modest and declining. However, the amount of food waste should not be neglected. A resident of Slovenia threw away an average of 72 kg of food in 2021, and most food waste is generated in households.
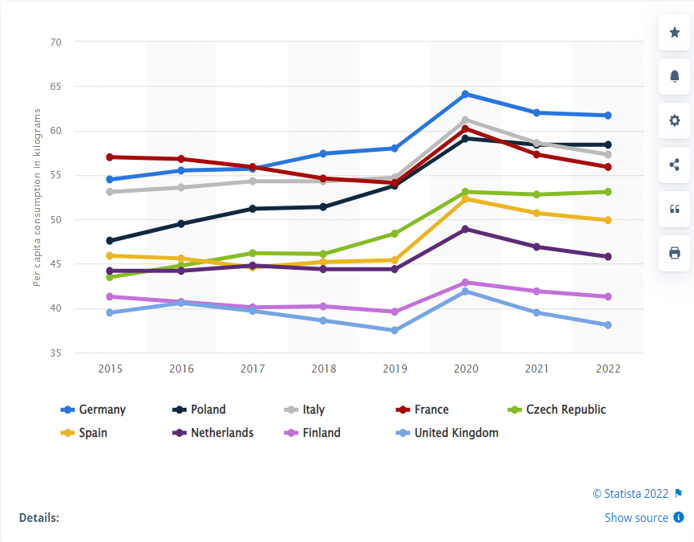
By far the world's largest consumers of meat are in North America. And meat consumption per capita is increasing in many EU countries.
Globally, livestock farming is the second largest source of greenhouse gas (GHG) emissions. The IPCC therefore calls for a change not only in agricultural practices, but also in our dietary habits.
Charts
Statistical Office of the Republic of Slovenia (23. 6. 2022)
| All meat[kg] | Meat of cattle[kg] | Meat of pigs[kg] | Sheep and goat meat[kg] | Meat of horses[kg] | Poultry meat[kg] | Other meat[kg] | Offal[kg] | |
|---|---|---|---|---|---|---|---|---|
| 2000 | 88.51 | 20.55 | 38.12 | 0.59 | 0.30 | 24.76 | 0.28 | 3.92 |
| 2001 | 93.04 | 20.23 | 41.29 | 0.71 | 0.35 | 26.05 | 0.31 | 4.11 |
| 2003 | 99.17 | 23.55 | 42.43 | 0.90 | 0.25 | 24.90 | 0.27 | 6.88 |
| 2010 | 93.70 | 19.94 | 41.55 | 1.01 | 0.20 | 27.72 | 0.38 | 2.90 |
| 2011 | 89.53 | 19.82 | 39.55 | 0.93 | 0.19 | 26.22 | 0.24 | 2.58 |
| 2013 | 82.24 | 18.57 | 35.54 | 0.82 | 0.15 | 24.76 | 0.26 | 2.13 |
| 2014 | 84.99 | 18.06 | 36.82 | 0.90 | 0.17 | 26.99 | 0.31 | 1.75 |
| 2015 | 88.32 | 18.99 | 37.02 | 0.95 | 0.16 | 28.88 | 0.38 | 1.95 |
| 2018 | 92.60 | 19.97 | 37.45 | 0.95 | 0.12 | 31.39 | 0.48 | 2.24 |
| 2019 | 90.77 | 20.11 | 36.54 | 0.88 | 0.13 | 30.63 | 0.57 | 1.92 |
| 2020 | 87.93 | 19.64 | 32.73 | 0.57 | 0.12 | 31.53 | 0.30 | 2.74 |
| 2021 | 89.28 | 20.63 | 32.78 | 0.91 | 0.11 | 30.97 | 0.42 | 3.46 |
Statistical Office of the Republic of Slovenia (23. 6. 2022)
| Self-sufficiency rate[ (%)] | Consumption per capita[(kg)] | |
|---|---|---|
| 2000 | 95 | 10.81 |
| 2003 | 104 | 6.85 |
| 2005 | 94 | 6.51 |
| 2006 | 97 | 7.03 |
| 2009 | 93 | 10.23 |
| 2011 | 96 | 10.12 |
| 2012 | 92 | 9.08 |
| 2016 | 95 | 10.67 |
| 2017 | 90 | 11.52 |
| 2018 | 96 | 10.85 |
| 2020 | 95 | 10.38 |
| 2021 | 97 | 10.80 |
Statistical Office of the Republic of Slovenia (23. 6. 2022)
| Fish (fresh and frozen)[kg] | |
|---|---|
| 2000 | 2 |
| 2002 | 2.10 |
| 2004 | 1.90 |
| 2005 | 1.80 |
| 2006 | 1.60 |
| 2009 | 1.40 |
| 2010 | 1.60 |
| 2012 | 1.50 |
| 2015 | 1.70 |
| 2018 | 1.10 |
Podatki o količini odpadne hrane za obdobje od leta 2020 naprej so revidirani. Revizija je bila opravljena na podlagi rezultatov sortirnih analiz mešanih komunalnih odpadkov, ki so jih izvedle pristojne institucije na podlagi Uredbe o obvezni občinski gospodarski javni službi zbiranja komunalnih odpadkov. Rezultati so pokazali večji delež odpadne hrane v mešanih komunalnih odpadkih, kot je bil upoštevan do zdaj, zato podatki niso popolnoma primerljivi s podatki do leta 2020. ()
| The resulting waste food - TOTAL[tons] | ... originated in food production (including primary) [tons] | ... created in the distribution and trade of food [tons] | ... originated in catering and food serving [tons] | ... generated in households [tons] | |
|---|---|---|---|---|---|
| 2013 | 118450 | 7950 | 9165 | 38313 | 63023 |
| 2014 | 125102 | 9516 | 9478 | 41348 | 64761 |
| 2015 | 133898 | 10001 | 12933 | 44824 | 66141 |
| 2016 | 137638 | 10726 | 14492 | 43899 | 68521 |
| 2017 | 131761 | 10485 | 13115 | 40568 | 67594 |
| 2018 | 139856 | 10839 | 13763 | 42071 | 73182 |
| 2019 | 140804 | 12118 | 14447 | 44388 | 69850 |
| 2020 | 154656 | 10904 | 15264 | 50035 | 78453 |
| 2021 | 154185 | 13561 | 14424 | 46568 | 79632 |
| 2022 | 150839 | 10645 | 14070 | 55839 | 70285 |
Statista, a leading provider of market and consumer data, Hamburg (October 6, 2022)
OECD-FAO Agricultural Outlook 2022-2031 (October 6, 2022)


