[EN15] Final energy consumption intensity
[EN15] Final energy consumption intensity

Key message

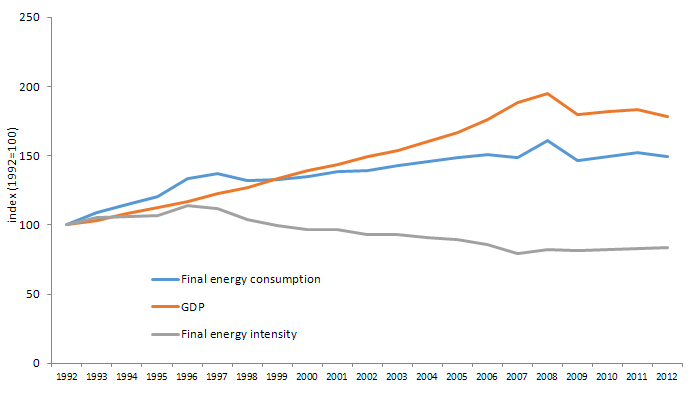
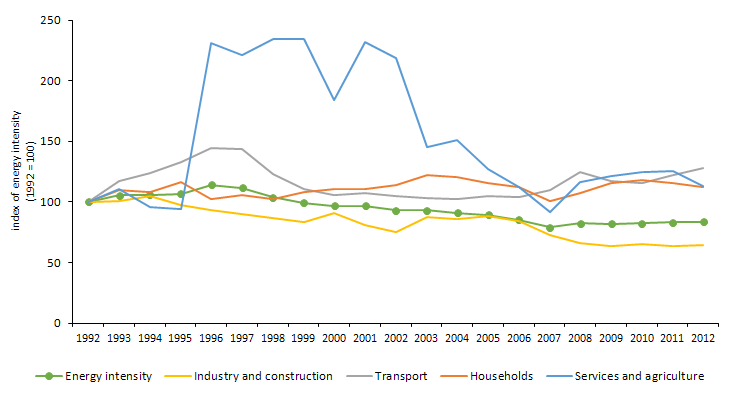
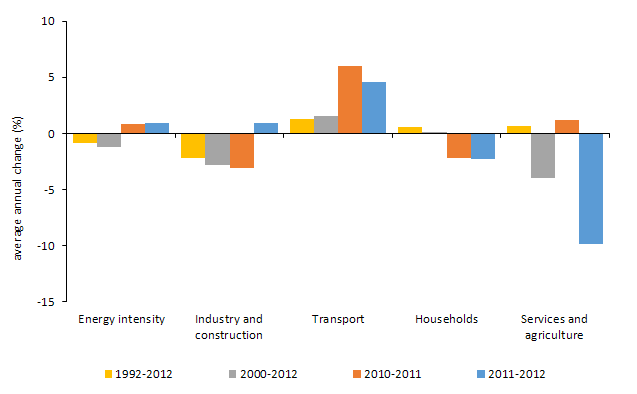
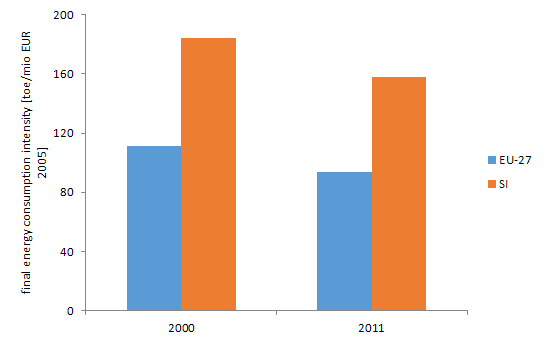
According to the size indicator of energy intensity of final energy consumption Slovenia is in significantly worse place than the average of EU-27. In the last three years, the energy intensity of final energy consumption increased. The only sector by reducing energy intensity in the last three years are households.
Definition
Charts
Figure EN15-1: Trend of final energy consumption , gross domestic product and final energy intesity for Slovenia according to 1992
Sources:
The Jožef Sten Institute, 2013; Statistical Office of the RS, 2013
| 1992 | 1993 | 1994 | 1995 | 1996 | 1997 | 1998 | 1999 | 2000 | 2001 | ||
|---|---|---|---|---|---|---|---|---|---|---|---|
| Final energy consumption | [ktoe] | 3278.7 | 3560.8 | 3759.2 | 3942.5 | 4371.3 | 4493.7 | 4317.5 | 4354.5 | 4427.1 | 4550.1 |
| GDP | [mio EUR 2005] | 17241 | 17731.2 | 18675.9 | 19442.9 | 20152.2 | 21151.2 | 21894.7 | 23060.6 | 24044.4 | 24751.1 |
| Final energy intensity | [toe/mio EUR 2005] | 190.2 | 200.8 | 201.3 | 202.8 | 216.9 | 212.5 | 197.2 | 188.8 | 184.1 | 183.8 |
| Final energy consumption | 1992=100 | 100 | 108.6 | 114.7 | 120.2 | 133.3 | 137.1 | 131.7 | 132.8 | 135 | 138.8 |
| GDP | 1992=100 | 100 | 102.8 | 108.3 | 112.8 | 116.9 | 122.7 | 127 | 133.8 | 139.5 | 143.6 |
| Final energy intensity | 1992=100 | 100 | 105.6 | 105.8 | 106.6 | 114.1 | 111.7 | 103.7 | 99.3 | 96.8 | 96.7 |
| 2002 | 2003 | 2004 | 2005 | 2006 | 2007 | 2008 | 2009 | 2010 | 2011 | ||
| Final energy consumption | [ktoe] | 4555.1 | 4686.9 | 4782.9 | 4870.1 | 4939.8 | 4882.4 | 5265.8 | 4811.8 | 4907.2 | 4982.4 |
| GDP | [mio EUR 2005] | 25698.4 | 26451.3 | 27615.6 | 28722.3 | 30402.4 | 32518.5 | 33618.7 | 30948.4 | 31337.9 | 31560 |
| Final energy intensity | [toe/mio EUR 2005] | 177.3 | 177.2 | 173.2 | 169.6 | 162.5 | 150.1 | 156.6 | 155.5 | 156.6 | 157.9 |
| Final energy consumption | 1992=100 | 138.9 | 142.9 | 145.9 | 148.5 | 150.7 | 148.9 | 160.6 | 146.8 | 149.7 | 152 |
| GDP | 1992=100 | 149.1 | 153.4 | 160.2 | 166.6 | 176.3 | 188.6 | 195 | 179.5 | 181.8 | 183.1 |
| Final energy intensity | 1992=100 | 93.2 | 93.2 | 91.1 | 89.2 | 85.4 | 79 | 82.4 | 81.8 | 82.3 | 83 |
| 2012 | |||||||||||
| Final energy consumption | [ktoe] | 4900.8 | |||||||||
| GDP | [mio EUR 2005] | 30757.4 | |||||||||
| Final energy intensity | [toe/mio EUR 2005] | 159.3 | |||||||||
| Final energy consumption | 1992=100 | 149.5 | |||||||||
| GDP | 1992=100 | 178.4 | |||||||||
| Final energy intensity | 1992=100 | 83.8 |
Figure EN15-2: Change of total final energy consumption intensity and by sector in period 1992-2012
Sources:
The Jožef Stefan Institute, 2013; Statistical Office of the RS, 2013
| 1992 | 1993 | 1994 | 1995 | 1996 | 1997 | 1998 | 1999 | 2000 | 2001 | ||
|---|---|---|---|---|---|---|---|---|---|---|---|
| Energy intensity | toe/mio € 2005 | 190 | 201 | 201 | 203 | 217 | 212 | 197 | 189 | 184 | 184 |
| Industry and construction | toe/mio € 2005 | 219 | 220 | 229 | 213 | 204 | 197 | 190 | 182 | 198 | 177 |
| Transport | toe/mio € 2005 | 51 | 60 | 64 | 68 | 74 | 74 | 63 | 57 | 54 | 55 |
| Households | toe/mio € 2005 | 512 | 560 | 555 | 594 | 526 | 539 | 523 | 554 | 565 | 567 |
| Services and agriculture | toe/mio € 2005 | 23 | 26 | 22 | 22 | 54 | 51 | 54 | 55 | 43 | 54 |
| Energy intensity | Index (1992 = 100) | 100 | 106 | 106 | 107 | 114 | 112 | 104 | 99 | 97 | 97 |
| Industry and construction | Index (1992 = 100) | 100 | 101 | 105 | 97 | 93 | 90 | 87 | 83 | 91 | 81 |
| Transport | Index (1992 = 100) | 100 | 117 | 124 | 133 | 144 | 144 | 123 | 111 | 106 | 107 |
| Households | Index (1992 = 100) | 100 | 109 | 109 | 116 | 103 | 105 | 102 | 108 | 110 | 111 |
| Services and agriculture | Index (1992 = 100) | 100 | 111 | 95 | 94 | 231 | 221 | 235 | 235 | 184 | 232 |
| 2002 | 2003 | 2004 | 2005 | 2006 | 2007 | 2008 | 2009 | 2010 | 2011 | ||
| Energy intensity | toe/mio € 2005 | 177 | 177 | 173 | 170 | 162 | 150 | 157 | 155 | 157 | 158 |
| Industry and construction | toe/mio € 2005 | 164 | 192 | 187 | 194 | 184 | 159 | 144 | 138 | 144 | 139 |
| Transport | toe/mio € 2005 | 54 | 53 | 53 | 54 | 54 | 56 | 64 | 60 | 59 | 63 |
| Households | toe/mio € 2005 | 583 | 626 | 617 | 592 | 576 | 517 | 549 | 593 | 603 | 590 |
| Services and agriculture | toe/mio € 2005 | 51 | 34 | 35 | 30 | 26 | 21 | 27 | 28 | 29 | 29 |
| Energy intensity | Index (1992 = 100) | 93 | 93 | 91 | 89 | 85 | 79 | 82 | 82 | 82 | 83 |
| Industry and construction | Index (1992 = 100) | 75 | 88 | 86 | 89 | 84 | 72 | 66 | 63 | 66 | 64 |
| Transport | Index (1992 = 100) | 105 | 103 | 102 | 105 | 104 | 110 | 124 | 117 | 116 | 122 |
| Households | Index (1992 = 100) | 114 | 122 | 121 | 116 | 113 | 101 | 107 | 116 | 118 | 115 |
| Services and agriculture | Index (1992 = 100) | 219 | 145 | 151 | 127 | 113 | 91 | 117 | 121 | 124 | 126 |
| 2012 | |||||||||||
| Energy intensity | toe/mio € 2005 | 159 | |||||||||
| Industry and construction | toe/mio € 2005 | 140 | |||||||||
| Transport | toe/mio € 2005 | 66 | |||||||||
| Households | toe/mio € 2005 | 576 | |||||||||
| Services and agriculture | toe/mio € 2005 | 26 | |||||||||
| Energy intensity | Index (1992 = 100) | 84 | |||||||||
| Industry and construction | Index (1992 = 100) | 64 | |||||||||
| Transport | Index (1992 = 100) | 128 | |||||||||
| Households | Index (1992 = 100) | 113 | |||||||||
| Services and agriculture | Index (1992 = 100) | 113 |
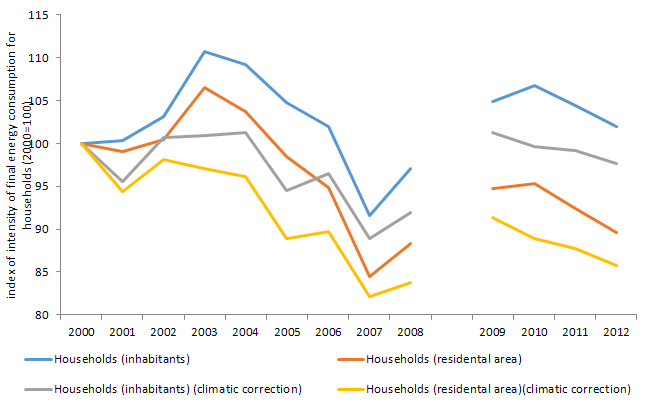
Figure EN15-3: Comparison of two methods for calculating the intensity of final energy consumption for households with the adjustment of the average cold winter and without
Sources:
The Jožef Stefan Institute, 2013; Statistical Office of the RS, 2013
| 2000 | 2001 | 2002 | 2003 | 2004 | 2005 | 2006 | 2007 | 2008 | ||
|---|---|---|---|---|---|---|---|---|---|---|
| Households (inhabitants) | Index (2000=100) | 100 | 100.3 | 103.2 | 110.8 | 109.1 | 104.7 | 101.9 | 91.5 | 97.1 |
| Households (residental area) | Index (2000=100) | 100 | 99.1 | 100.5 | 106.5 | 103.7 | 98.5 | 94.8 | 84.5 | 88.4 |
| Households (inhabitants) (climatic correction) | Index (2000=100) | 100 | 95.6 | 100.7 | 100.9 | 101.2 | 94.6 | 96.5 | 88.9 | 92 |
| Households (residental area)(climatic correction) | Index (2000=100) | 100 | 94.4 | 98.1 | 97.1 | 96.2 | 88.9 | 89.7 | 82.1 | 83.7 |
Figure EN15-4: Average annual growth of total final energy consumption intensity and by sector in different periods
Sources:
The Jožef Stefan Institute, 2013; Statistical Office of the RS, 2013
| Energy intensity | Industry and construction | Transport | Households | Services and agriculture | ||
|---|---|---|---|---|---|---|
| 1992-2012 | %/year | -0.9 | -2.2 | 1.2 | 0.6 | 0.6 |
| 2000-2012 | %/year | -1.2 | -2.8 | 1.6 | 0.2 | -4 |
| 2010-2011 | %/year | 0.8 | -3.1 | 6 | -2.2 | 1.2 |
| 2011-2012 | %/year | 0.9 | 0.9 | 4.6 | -2.3 | -9.9 |
Figure EN15-5: Trend of final energy consumption intesity for Slovenia and EU-27 for years 2000 and 2011
Sources:
EUROSTAT, 2013; The Jožef Stefan Institute, 2013
| 2000 | 2011 | ||
|---|---|---|---|
| EU-27 | toe/mio EUR 2005 | 111 | 93.8 |
| SI | toe/mio EUR 2005 | 184.1 | 157.9 |


