[VD06] Pesticides in groundwater

Key message

In general, the levels of pesticides in groundwater are decreasing. In Slovenian lowlands (the Drava and Mura river basins), which are characterised by intensive agricultural activity, certain pesticides, phytopharmaceuticals in particular, still exceed quality standards. Individual point sources of pollution can be a result of unskilled use of plant protection products.
Definition
An aquifer is a geological layer that has the ability to accumulate and transfer relevant amounts of groundwater. Two types of aquifers prevail in Slovenia – aquifers with intergranular porosity (alluvial aquifers) and aquifers with karst and fissure porosity. A groundwater body includes water in one or several adjacent aquifers. In Slovenia, 21 groundwater bodies are officially recognised by regulations.
Pesticides, which are monitored within the national monitoring programme, include artificial organic compounds intended for weed control and the control of insects, pests and diseases. According to the purpose of their use, they include plant protection products (hereinafter referred to as: PPP) for the protection of crops and, to a lesser extent, biocides. Biocides are added to wood protection and façade coatings, they are used for extermination of rodents and lice, as disinfectants, etc.
Improper use of pesticides may pollute groundwater, which is the main source of drinking water in Slovenia. Since pesticides are harmful to the environment and human health, monitoring of their levels in the groundwater is very important. Within the national monitoring programme, approximately 100 different pesticides and their decomposition products – or metabolites – are analysed.
Charts
Standardised Database for Water Quality Monitoring, Slovenian Environemental Agency, 2016
Standardised Database for Water Quality Monitoring, Environmental Agency of the Republic of Slovenia, 2016
| 1998 | 1999 | 2000 | 2001 | 2002 | 2003 | 2004 | 2005 | 2006 | 2007 | ||
|---|---|---|---|---|---|---|---|---|---|---|---|
| Sava basin and Ljubljana moor | µg/L | 0.18 | 0.24 | 0.2 | 0.13 | 0.12 | 0.17 | 0.15 | 0.16 | 0.1 | 0.26 |
| Savinja basin | µg/L | 0.23 | 0.45 | 0.35 | 0.3 | 0.33 | 0.23 | 0.26 | 0.14 | 0.17 | 0.48 |
| Krka basin | µg/L | 0.02 | 0.03 | 0.03 | 0.07 | 0.06 | 0.06 | 0.07 | 0.09 | 0.19 | 0.06 |
| Drava basin | µg/L | 0.7 | 0.79 | 0.75 | 0.51 | 0.48 | 0.46 | 0.33 | 0.29 | 0.27 | 0.27 |
| Mura basin | µg/L | 0.33 | 0.65 | 0.4 | 0.26 | 0.2 | 0.33 | 0.23 | 0.17 | 0.2 | |
| quality standard | µg/L | 0.5 | 0.5 | 0.5 | 0.5 | 0.5 | 0.5 | 0.5 | 0.5 | 0.5 | 0.5 |
| 2008 | 2009 | 2010 | 2011 | 2012 | 2013 | 2014 | 2015 | ||||
| Sava basin and Ljubljana moor | µg/L | 0.12 | 0.1 | 0.07 | 0.04 | 0.05 | 0.03 | 0.02 | 0.03 | ||
| Savinja basin | µg/L | 0.14 | 0.17 | 0.27 | 0.06 | 0.08 | 0.05 | 0.06 | 0.07 | ||
| Krka basin | µg/L | 0.1 | 0.09 | 0.08 | 0.08 | 0.07 | 0.07 | 0.05 | 0.07 | ||
| Drava basin | µg/L | 0.23 | 0.23 | 0.2 | 0.26 | 0.2 | 0.18 | 0.13 | 0.13 | ||
| Mura basin | µg/L | 0.16 | 0.18 | 0.11 | 0.14 | 0.17 | 0.17 | 0.12 | 0.15 | ||
| quality standard | µg/L | 0.5 | 0.5 | 0.5 | 0.5 | 0.5 | 0.5 | 0.5 | 0.5 |
Standardised Database for Water Quality Monitoring, Slovenian Environmental Agency, 2015
| 1998 | 1999 | 2000 | 2001 | 2002 | 2003 | 2004 | 2005 | 2006 | 2007 | ||
|---|---|---|---|---|---|---|---|---|---|---|---|
| Benica (Mura basin) | µg/L | 0.18 | 1.93 | 0.79 | 0.16 | 0.05 | 0.2 | 1 | 0.52 | 0.73 | |
| Brunšvik (Drava basin) | µg/L | 2.68 | 1.92 | 2.21 | 1.56 | 1.5 | 1.38 | 1.12 | 1.03 | 1.02 | 1.03 |
| Šikole (Drava basin) | µg/L | 1.52 | 1.26 | 1.2 | 1.12 | 1.27 | 1.19 | 0.91 | 0.61 | 0.51 | 0.59 |
| Kidričevo (Drava basin) | µg/L | 1.93 | 1.76 | 1.69 | 1.33 | 1.52 | 1.57 | 1.46 | 1.49 | 1.23 | 1.23 |
| Gotovlje (Savinja basin) | µg/L | 0.39 | 0.49 | 0.94 | 0.27 | 0.34 | 0.26 | 0.53 | 0.17 | 0.14 | 2.87 |
| Podreča (Sava basin) | µg/L | 1.29 | 1.54 | 1.6 | 0.14 | 0.09 | 1.57 | 1.21 | 0.38 | 0.25 | 0.1 |
| quality standard | µg/L | 0.5 | 0.5 | 0.5 | 0.5 | 0.5 | 0.5 | 0.5 | 0.5 | 0.5 | 0.5 |
| 2008 | 2009 | 2010 | 2011 | 2012 | 2013 | 2014 | 2015 | ||||
| Benica (Mura basin) | µg/L | 0.65 | 0.76 | 0.36 | 0.26 | 0.56 | 0.21 | 0.28 | 0.94 | ||
| Brunšvik (Drava basin) | µg/L | 0.74 | 0.58 | 0.6 | 0.71 | 0.7 | 0.43 | 0.44 | 0.42 | ||
| Šikole (Drava basin) | µg/L | 0.38 | 0.43 | 0.32 | 0.45 | 0.42 | 0.24 | 0.2 | 0.21 | ||
| Kidričevo (Drava basin) | µg/L | 1.18 | 0.94 | 0.97 | 1.02 | 0.97 | 0.83 | 0.63 | 0.58 | ||
| Gotovlje (Savinja basin) | µg/L | 0.12 | 1.07 | 0.13 | 0.08 | 0.12 | 0.2 | 0.19 | 0 | ||
| Podreča (Sava basin) | µg/L | 0.16 | 0.63 | 1.19 | 0.54 | 0.79 | 0.25 | 0 | 0.79 | ||
| quality standard | µg/L | 0.5 | 0.5 | 0.5 | 0.5 | 0.5 | 0.5 | 0.5 | 0.5 |
Standardised Database for Water Quality Monitoring, Slovenian Environmental Agency, 2016
| 1998 | 1999 | 2000 | 2001 | 2002 | 2003 | 2004 | 2005 | 2006 | 2007 | ||
|---|---|---|---|---|---|---|---|---|---|---|---|
| Rakičan (Mura basin) | µg/L | 0.38 | 0.37 | 0.33 | 0.29 | 0.26 | 0.2 | 0.16 | 0.13 | 0.09 | |
| Lipovci (Mura basin) | µg/L | 0.49 | 0.39 | 0.42 | 0.18 | 0.14 | 0.11 | 0.11 | 0.09 | 0.1 | |
| Brunšvik (Drava basin) | µg/L | 0.69 | 0.5 | 0.53 | 0.32 | 0.37 | 0.35 | 0.3 | 0.28 | 0.25 | 0.26 |
| Šikole (Drava basin) | µg/L | 0.91 | 0.6 | 0.6 | 0.52 | 0.72 | 0.71 | 0.52 | 0.36 | 0.24 | 0.32 |
| Kidričevo (Drava basin) | µg/L | 1.35 | 1.1 | 1.05 | 0.76 | 0.99 | 1 | 0.99 | 1.02 | 0.88 | 0.87 |
| Gotovlje (Savinja basin) | µg/L | 0.13 | 0.14 | 0.62 | 0.07 | 0.13 | 0.08 | 0.06 | 0.05 | 0.04 | 0.05 |
| quality standard | µg/L | 0.1 | 0.1 | 0.1 | 0.1 | 0.1 | 0.1 | 0.1 | 0.1 | 0.1 | 0.1 |
| 2008 | 2009 | 2010 | 2011 | 2012 | 2013 | 2014 | 2015 | ||||
| Rakičan (Mura basin) | µg/L | 0.08 | 0.07 | 0.05 | 0.05 | 0.04 | 0.04 | 0.03 | 0.02 | ||
| Lipovci (Mura basin) | µg/L | 0.11 | 0.09 | 0.08 | 0.08 | 0.09 | 0.03 | 0.04 | 0.06 | ||
| Brunšvik (Drava basin) | µg/L | 0.24 | 0.18 | 0.17 | 0.19 | 0.18 | 0.14 | 0.14 | 0.13 | ||
| Šikole (Drava basin) | µg/L | 0.25 | 0.24 | 0.18 | 0.19 | 0.18 | 0.13 | 0.12 | 0.13 | ||
| Kidričevo (Drava basin) | µg/L | 0.86 | 0.69 | 0.71 | 0.72 | 0.69 | 0.58 | 0.45 | 0.41 | ||
| Gotovlje (Savinja basin) | µg/L | 0.04 | 0.03 | 0.03 | 0.03 | 0.02 | 0.02 | 0.02 | 0.02 | ||
| quality standard | µg/L | 0.1 | 0.1 | 0.1 | 0.1 | 0.1 | 0.1 | 0.1 | 0.1 |
Standardised Database for Water Quality Monitoring, Slovenian Environmental Agency, 2016
| 1998 | 1999 | 2000 | 2001 | 2002 | 2003 | 2004 | 2005 | 2006 | 2007 | ||
|---|---|---|---|---|---|---|---|---|---|---|---|
| Rakičan (Mura basin) | µg/L | 0.58 | 0.45 | 0.52 | 0.22 | 0.18 | 0.12 | 0.1 | 0.09 | 0.07 | |
| Lipovci (Mura basin) | µg/L | 0.63 | 0.48 | 0.53 | 0.38 | 0.4 | 0.32 | 0.29 | 0.19 | 0.23 | |
| Brunšvik (Drava basin) | µg/L | 0.38 | 0.4 | 0.37 | 0.26 | 0.27 | 0.27 | 0.21 | 0.2 | 0.17 | 0.19 |
| Šikole (Drava basin) | µg/L | 0.46 | 0.41 | 0.37 | 0.37 | 0.43 | 0.36 | 0.28 | 0.21 | 0.15 | 0.19 |
| Kidričevo (Drava basin) | µg/L | 0.56 | 0.55 | 0.56 | 0.42 | 0.48 | 0.48 | 0.43 | 0.42 | 0.34 | 0.34 |
| Gotovlje (Savinja basin) | µg/L | 0.27 | 0.28 | 0.22 | 0.2 | 0.17 | 0.17 | 0.12 | 0.12 | 0.1 | 0.08 |
| quality standard | µg/L | 0.1 | 0.1 | 0.1 | 0.1 | 0.1 | 0.1 | 0.1 | 0.1 | 0.1 | 0.1 |
| 2008 | 2009 | 2010 | 2011 | 2012 | 2013 | 2014 | 2015 | ||||
| Rakičan (Mura basin) | µg/L | 0.06 | 0.05 | 0.04 | 0.04 | 0.03 | 0.02 | 0.02 | 0.02 | ||
| Lipovci (Mura basin) | µg/L | 0.23 | 0.17 | 0.16 | 0.15 | 0.16 | 0.06 | 0.05 | 0.07 | ||
| Brunšvik (Drava basin) | µg/L | 0.16 | 0.11 | 0.12 | 0.15 | 0.12 | 0.1 | 0.08 | 0.06 | ||
| Šikole (Drava basin) | µg/L | 0.13 | 0.14 | 0.13 | 0.19 | 0.18 | 0.11 | 0.08 | 0.08 | ||
| Kidričevo (Drava basin) | µg/L | 0.3 | 0.25 | 0.26 | 0.28 | 0.29 | 0.25 | 0.18 | 0.17 | ||
| Gotovlje (Savinja basin) | µg/L | 0.07 | 0.05 | 0.06 | 0.06 | 0.04 | 0.03 | 0.02 | 0.02 | ||
| quality standard | µg/L | 0.1 | 0.1 | 0.1 | 0.1 | 0.1 | 0.1 | 0.1 | 0.1 |
Goals
- To improve the state of groundwater and reduce the levels of pesticides in drinking water and sources of drinking water in accordance with the standards prescribed by legislation;
- to reduce environmental hazards and risks posed by the use of pesticides, particularly in relation to the water environment;
- to improve control of the use of pesticides;
- to replace hazardous active components of pesticides with less hazardous components;
- to promote agriculture that involves a reduced use of pesticides, transparent system of monitoring and reporting on the successful attainment of objectives and development of appropriate indicators;
- to improve and restore groundwater bodies and to provide a balance between the abstraction and restoration of groundwater;
- to have achieved a good state of groundwater no later than by 2015.
Comment
The Decree on Groundwater Status (2009) defines quality standards for individual pesticides, their relevant metabolites and standards for the sum of pesticides. Groundwater is deemed to be over-polluted with pesticides or their relevant metabolites as follows:
- when the levels exceed 0.1 µg/L;
- in case levels of individual organo-chlorine pesticides from the group of drines (aldrin, dieldrin, endrin) exceed 0.03 µg/L;
- when the sum of pesticides exceeds 0.5 µg/L.
Slovenia is divided into 21 groundwater bodies. In 2015, monitoring of groundwater quality was carried out in Slovenia. 194 gauging stations distributed across 14 water bodies were included in the monitoring. In 2014 and 2015, the monitoring network was upgraded with new gauging stations built under the BOBER project. The stations were built on water bodies exposed to higher than normal levels of pollution. The monitoring programme included water bodies with the highest concentrations of pesticides in intergranular aquifers and karst/fractured water bodies where large drinking water wells are located and where, based on pressure analyses, pollution of drinking water sources may occur.
Groundwater in intergranular aquifers, especially in north-eastern Slovenia, is the most polluted with pesticides of all water bodies in Slovenia. The reason for high levels of pesticide pollution of groundwater is more intensive land use in lowland areas of Slovenia (the Savinja, Drava and Mura basins, in particular) where aquifers with intergranular porosity prevail. Groundwater in karst and fractured aquifers is less contaminated with pesticides due to geographical conditions, lower population density and smaller areas of cultivated land.
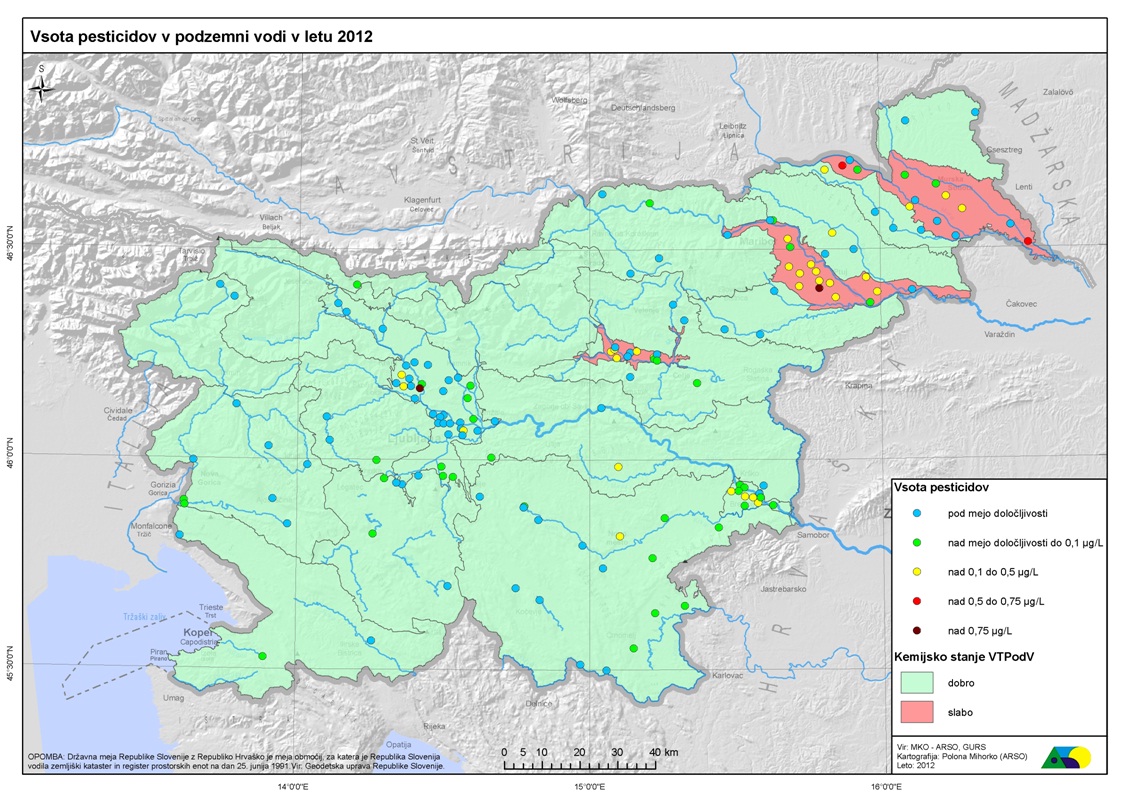
For all water bodies that were included in the groundwater monitoring programme in 2015, the map shows the annual average of the sum of pesticides in groundwater at individual gauging stations (VD06-1).
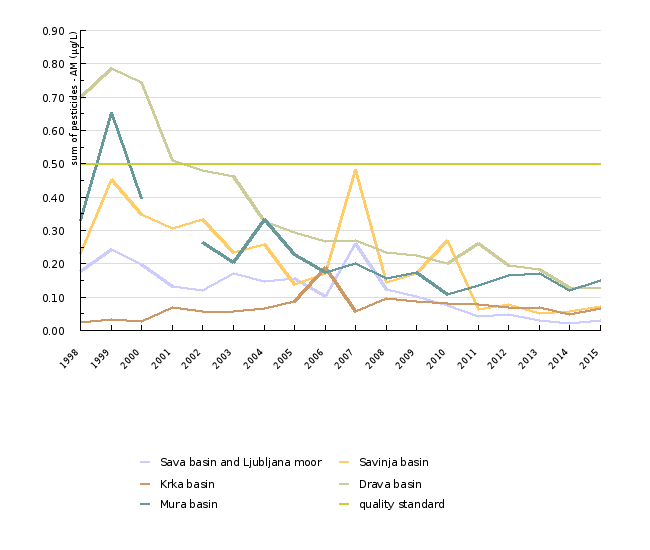
The concentration of the sum of pesticides in groundwater bodies with alluvial aquifers decreased in the period 1998–2015. The sum of pesticides has been decreasing primarily due to decreasing concentrations of atrazine and its metabolite desethyl-atrazine, which indicates a positive effect of the prohibition of the use of atrazine (VD06-2). Instead, other plant protection products are now in use today that are less frequently detected in groundwater due to their more favourable physical/chemical properties (quick decomposition, better adsorption, etc.). In more polluted water bodies (the Savinja, Drava, Mura basins), a declining trend in the sum of pesticides has been observed.
The mean annual value of the sum of pesticides is presented for the gauging stations more exposed to groundwater pollution,. Decreasing trends were observed at Šikole, Podova (former Brunšvik) and Kidričevo gauging stations (all in the Drava basin) in the period 1998–2015. At Benica (Mura basin), Podreča (Sava basin and the Ljubljana Marshes) and Gotovlje (Savinja basin), a high fluctuation in the level of the sum of pesticides was observed (VD06-3).
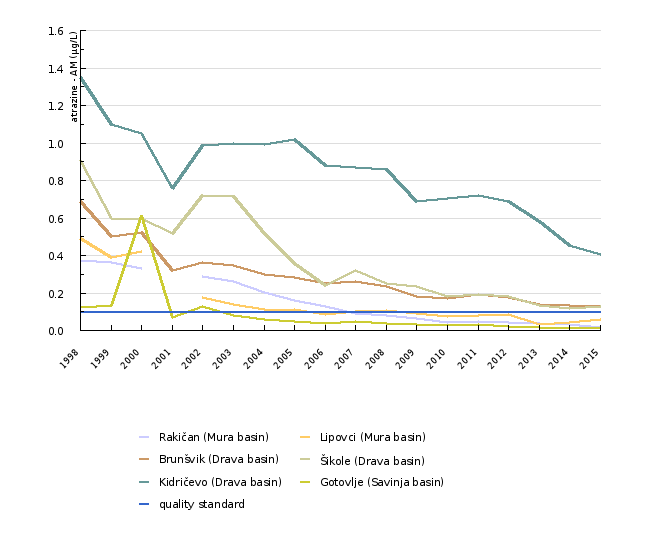
For the period 1998–2015, mean annual values of atrazine and desethyl-atrazine are presented for the gauging stations more exposed to groundwater pollution (Rakičan, Lipovci in the Mura basin, Podova [formerly Brunšvik], Šikole and Kidričevo in the Drava basin and Gotovlje in the Savinja basin). A statistically significant decreasing trend of atrazine concentration in the period 1998–2015 was observed at the gauging stations of Šikole, Kidričevo and Podova (formerly Brunšvik) (Drava basin) and Lipovci (Mura basin). Atrazine concentrations are still very high at the Kidričevo station, while the standard has also been exceeded at the Podova and Šikole stations (the three stations are all located in the middle section of the Drava basin). Desethyl-atrazine values decreased over the period 1998–2015 at all the above-mentioned gauging stations.
The results of the monitoring of pesticides in groundwater indicate that their correct use does not present a higher risk for the quality of groundwater. However, in future, more attention will have to be paid to education and raising awareness among the users of plant protection products. At the same time, competent inspection authorities will have to take timely action in cases of over-polluted groundwater.


