[PP05] Changes in glacier extent

Key message

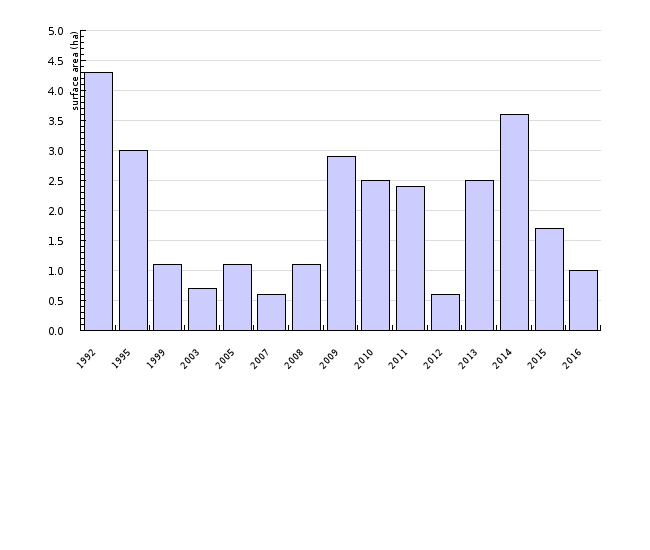
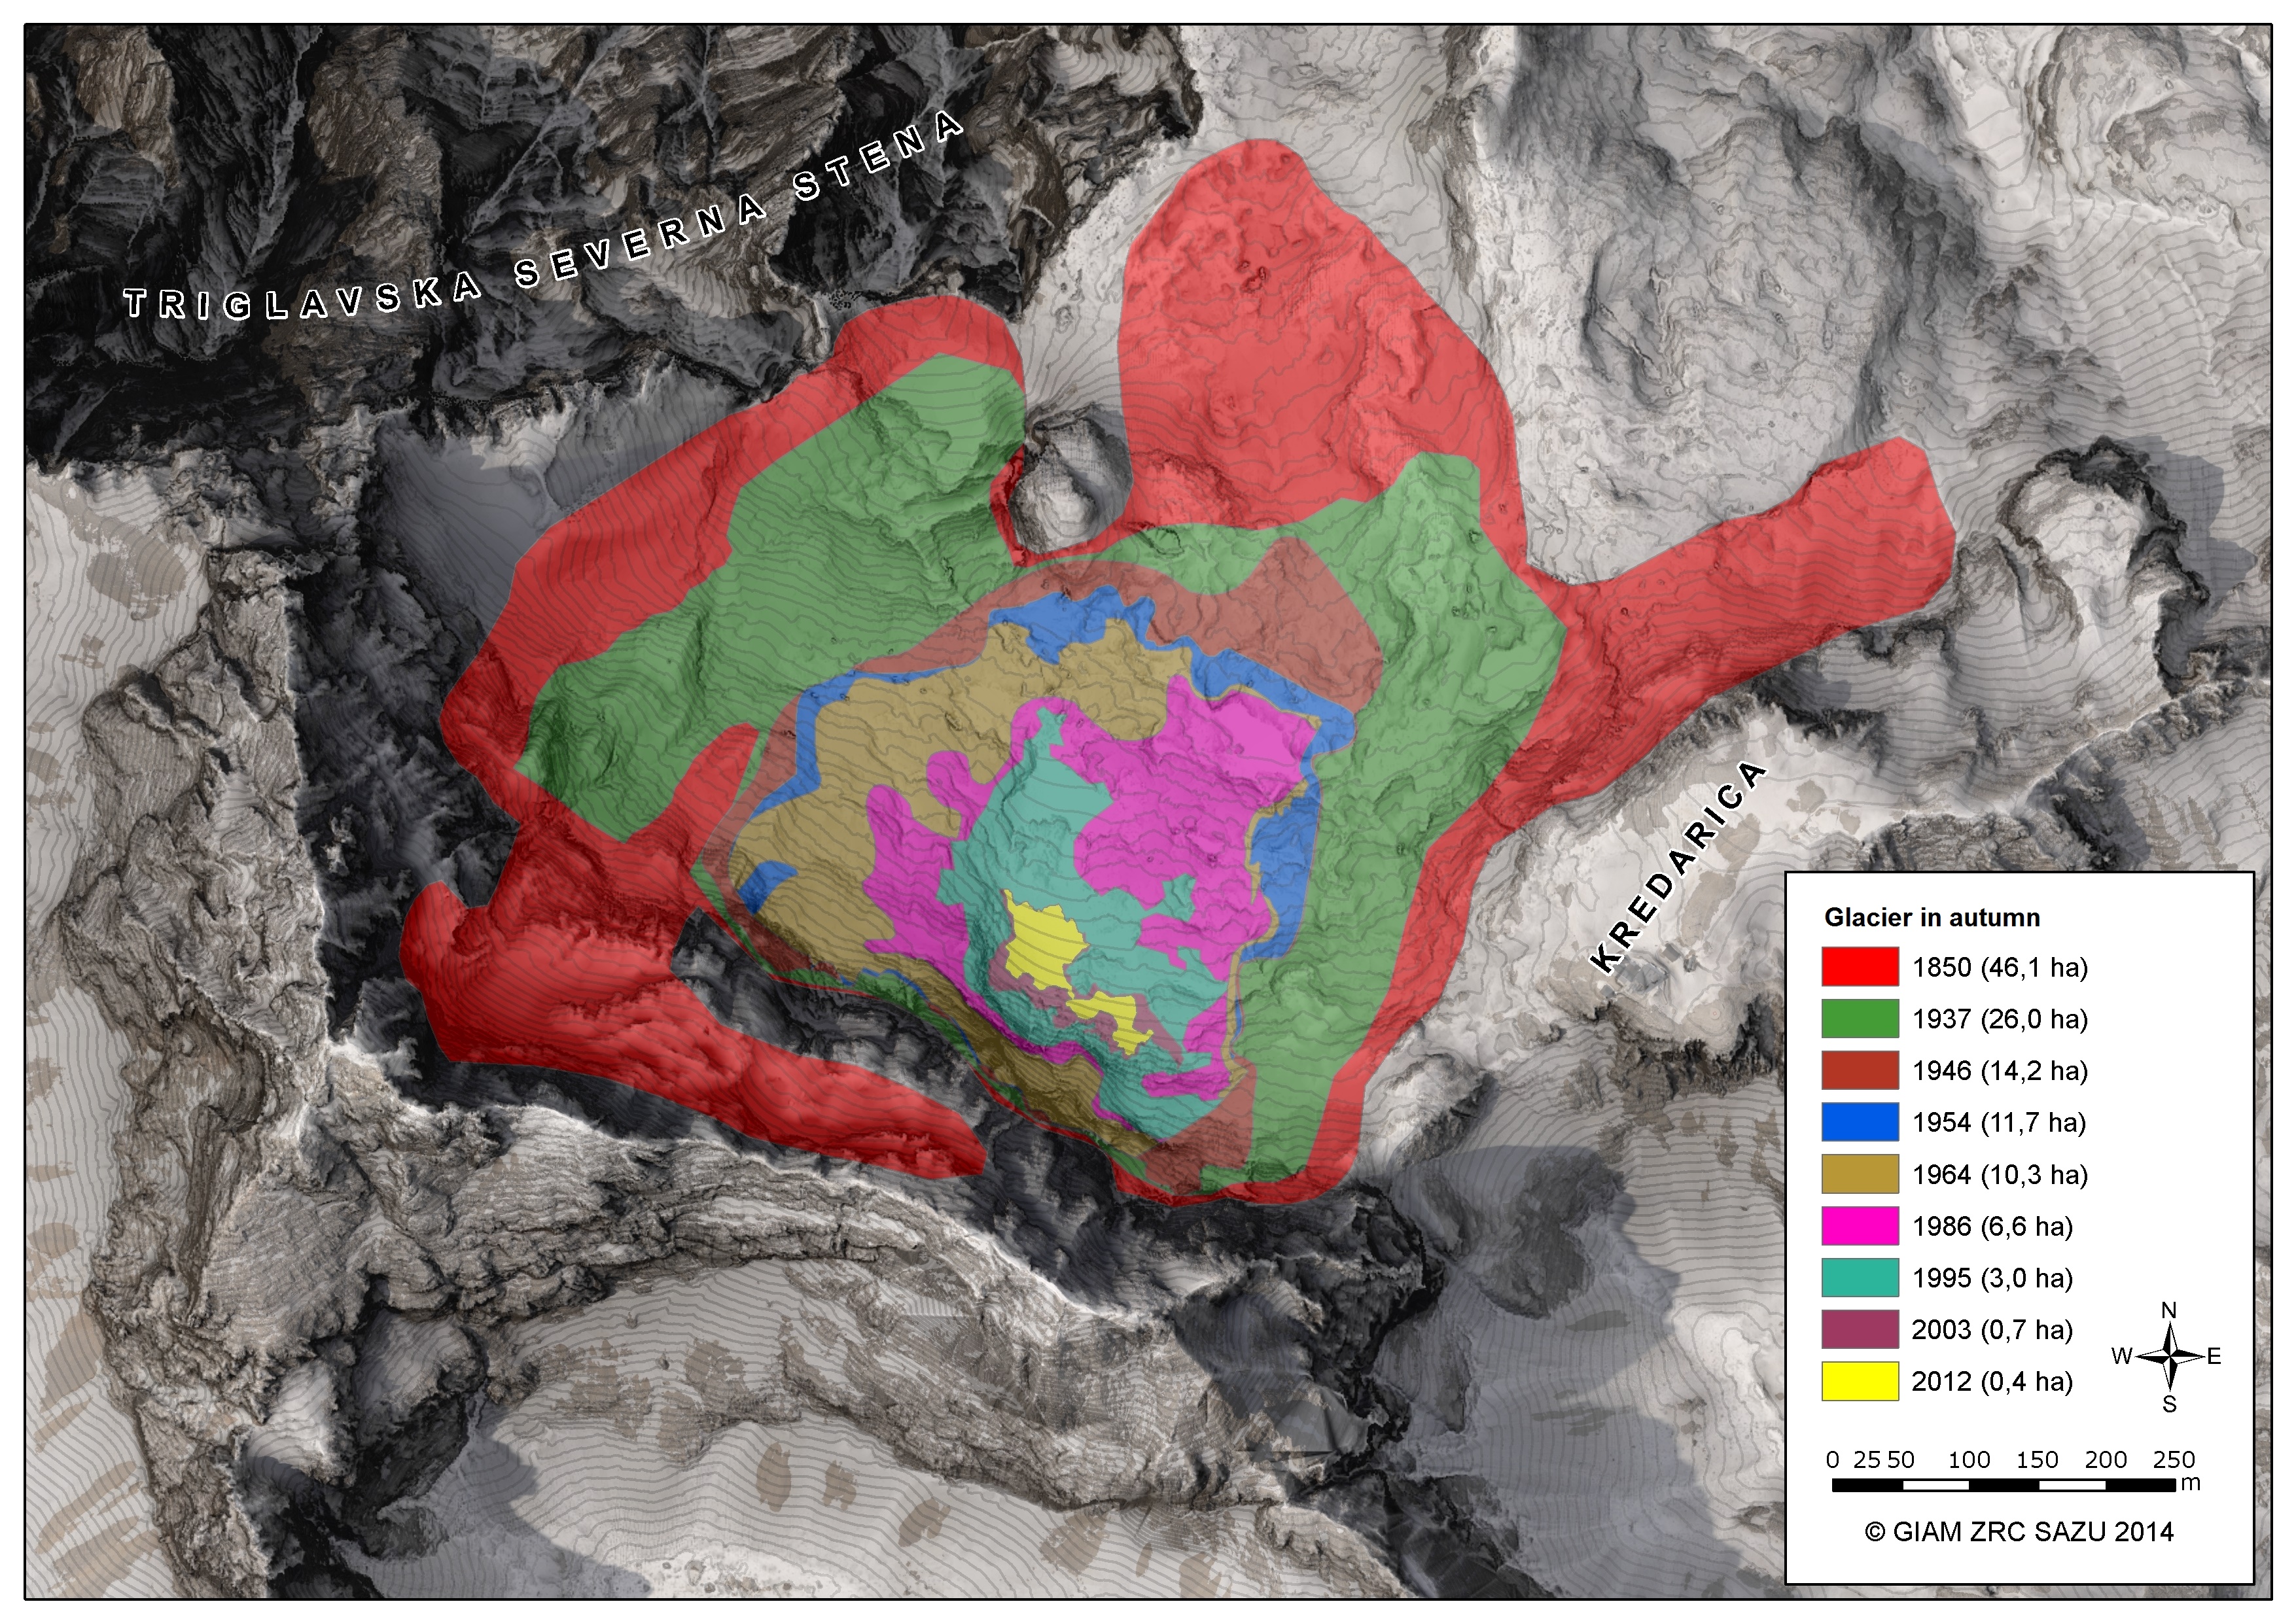
The quick rate of retreat of the Triglav Glacier, which began in the second half of the 20th century, further accelerated throughout the 90s. Due to increasing intensity of ice thinning, outcropping rocks began to emerge in the middle of the glacier, which disintegrated into two parts in 1992. In the 21st century, the glacier has been retreating at a slower rate. The last major recession of the glacier was registered after the above average hot summer of 2003. The process stalled in years with above-average snowfall in late spring.
Definition
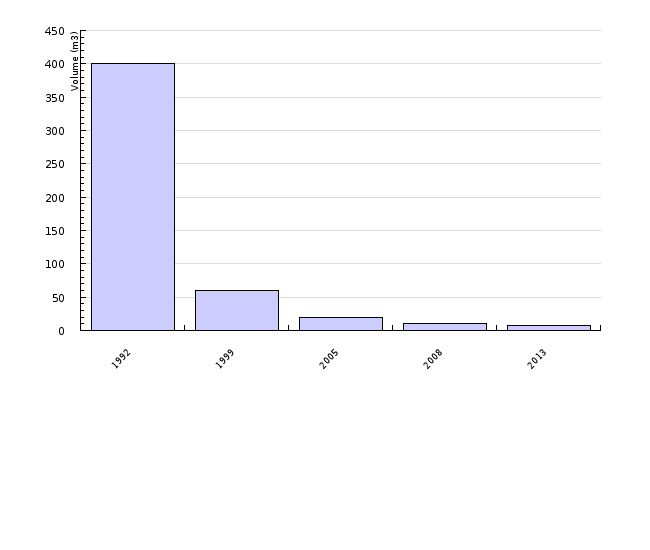
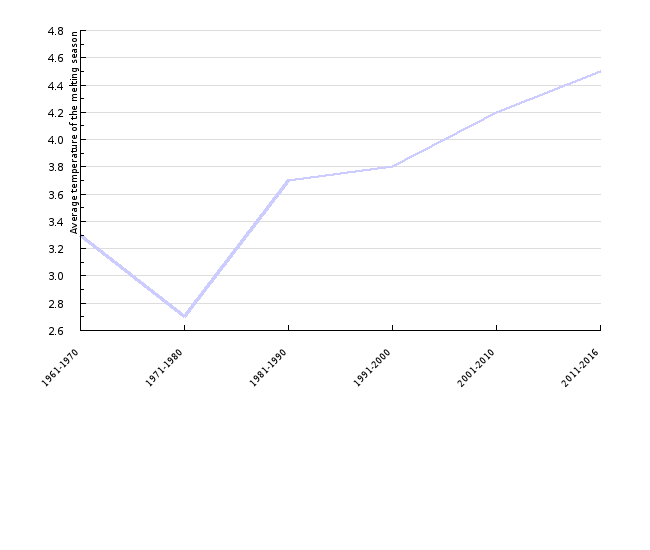
This indicator shows changes in the surface area and volume of the Triglav glacier in the period 1992–2016 (volume measurements are periodical) and the average decade temperature of the melting season (May–October) at Kredarica in the period 1961–2016. The cumulative specific mass balance of selected European glaciers in the period 1946 – 2014 and in 2015 is presented as well. The measured surface area of the Triglav glacier includes glacier ice as well as snow directly above or adjacent to the glacier unless indicated otherwise. Glacier ice is entirely exposed only on rare occasions and only exceptionally for the period of several consecutive years.
Mass balance is the difference between accumulation and ablation of ice or snow covering the glacier. Due to variable density of snow and ice, it is expressed in mm of water equivalent. Specific mass balance means an average value per unit of surface area.
A glacier is a perennial mass of ice on the Earth’s surface that moves downslope under its own weight in response to gravitational force. A glacier forms above the snow line in locations where the mass accumulation of snow and ice exceeds ablation over many years. The snow is gradually transformed into glacier ice, which moves downslope reaching below the snow line until the glacier ice disappears due to prevailing ablation. The key factors of ablation are: sun radiation (intensity, duration), air temperature, precipitation and wind (Gabrovec, Zakšek, 2007).
Changes in glacier volume and extent are an illustrative indicator of climate change. During the last decade, the trend of rapid glacier retreat has been characteristic of all Alpine glaciers. In Slovenia, there are two glaciers: the Triglav glacier and the Skuta glacier. Due to their extreme south-eastern position and low altitude, both are exceptionally sensitive to climate changes. Due to the small size of Slovenian glaciers, their relative retreat in respect to their present extent and volume is greater than in other Alpine glaciers.
Charts
Anton Melik Geographical Institute, Slovenian Academy of Sciences and Arts, 2016.
| 1992 | 1995 | 1999 | 2003 | 2005 | 2007 | 2008 | 2009 | 2010 | 2011 | ||
|---|---|---|---|---|---|---|---|---|---|---|---|
| surface | ha | 4.3 | 3 | 1.1 | 0.7 | 1.1 | 0.6 | 1.1 | 2.9 | 2.5 | 2.4 |
| 2012 | 2013 | 2014 | 2015 | 2016 | |||||||
| surface | ha | 0.6 | 2.5 | 3.6 | 1.7 | 1 |
Anton Melik Geographical Institute, Slovenian Academy of Sciences and Arts, 2013.
| 1992 | 1999 | 2005 | 2008 | 2013 | ||
|---|---|---|---|---|---|---|
| Volume | (1000m3) | 400 | 60 | 20 | 10 | 7.4 |
Gabrovec, M., Hrvatin, M., Komac, B., Ortar, J., Pavšek, M., Topole, M., Triglav Čekada, M. in Zorn, M., 2014: Triglav glacier, page. 234.
Slovenian Environment Agency, 2016.
| 1961-1970 | 1971-1980 | 1981-1990 | 1991-2000 | 2001-2010 | 2011-2016 | ||
|---|---|---|---|---|---|---|---|
| Average temperature of the melting season | oC | 3.3 | 2.7 | 3.7 | 3.8 | 4.2 | 4.5 |
World Glacier Monitoring Service, 2016.
| 1946 | 1947 | 1948 | 1949 | 1950 | 1951 | 1952 | 1953 | 1954 | 1955 | ||
|---|---|---|---|---|---|---|---|---|---|---|---|
| Careser (IT) | mm w.e. | ||||||||||
| Gries (CH) | mm w.e. | ||||||||||
| Hintereis (AT) | mm w.e. | 0 | -540 | -826 | -750 | ||||||
| Saint Sorlin (FR) | mm w.e. | ||||||||||
| Sarennes (FR) | mm w.e. | 0 | -2990 | -4610 | -4410 | -6030 | -6670 | -7220 | -6560 | ||
| Vernagt (AT) | mm w.e. | ||||||||||
| Storglaciaeren (SE) | mm w.e. | -1130 | -3190 | -3190 | -2290 | -3580 | -4230 | -4390 | -5200 | -6170 | -6330 |
| Nigardsbreen (NO) | mm w.e. | ||||||||||
| Austre Broeggerbreen (NO) | mm w.e. | ||||||||||
| Aalfotbreen (NO) | mm w.e. | ||||||||||
| Hofsjokull N (IS) | mm w.e. | ||||||||||
| Maladeta (ES) | mm w.e. | ||||||||||
| 1956 | 1957 | 1958 | 1959 | 1960 | 1961 | 1962 | 1963 | 1964 | 1965 | ||
| Careser (IT) | mm w.e. | ||||||||||
| Gries (CH) | mm w.e. | 0 | -984 | -1164 | -1852 | -1407 | |||||
| Hintereis (AT) | mm w.e. | -1025 | -1214 | -2195 | -2958 | -3020 | -3225 | -3921 | -4524 | -5768 | -4843 |
| Saint Sorlin (FR) | mm w.e. | 0 | -360 | -330 | -1540 | -1870 | -1760 | -2860 | -2590 | -4240 | -3780 |
| Sarennes (FR) | mm w.e. | -7160 | -7680 | -8350 | -9610 | -9490 | -9880 | -10790 | -10600 | -12430 | -12400 |
| Vernagt (AT) | mm w.e. | 0 | 751 | ||||||||
| Storglaciaeren (SE) | mm w.e. | -6810 | -7130 | -7780 | -8750 | -10360 | -11460 | -11140 | -11330 | -10840 | -10410 |
| Nigardsbreen (NO) | mm w.e. | 0 | 2250 | 2030 | 2980 | 3890 | |||||
| Austre Broeggerbreen (NO) | mm w.e. | ||||||||||
| Aalfotbreen (NO) | mm w.e. | 0 | -1100 | -820 | -340 | ||||||
| Hofsjokull N (IS) | mm w.e. | ||||||||||
| Maladeta (ES) | mm w.e. | ||||||||||
| 1966 | 1967 | 1968 | 1969 | 1970 | 1971 | 1972 | 1973 | 1974 | 1975 | ||
| Careser (IT) | mm w.e. | 0 | -390 | -130 | -130 | -760 | -1410 | -1010 | -2290 | -2610 | -2440 |
| Gries (CH) | mm w.e. | -1764 | -1735 | -1356 | -623 | -1381 | -1908 | -1500 | -2595 | -2773 | -2395 |
| Hintereis (AT) | mm w.e. | -4499 | -4479 | -4141 | -4572 | -5124 | -5724 | -5798 | -7027 | -6972 | -6907 |
| Saint Sorlin (FR) | mm w.e. | -3080 | -3540 | -2730 | -2290 | -2160 | -3010 | -3250 | -4010 | -4830 | -4550 |
| Sarennes (FR) | mm w.e. | -11980 | -12390 | -12050 | -12410 | -12820 | -13920 | -14290 | -15160 | -16760 | -16650 |
| Vernagt (AT) | mm w.e. | 1383 | 1466 | 1767 | 1460 | 1236 | 812 | 949 | 489 | 719 | 890 |
| Storglaciaeren (SE) | mm w.e. | -10940 | -11170 | -11270 | -12310 | -13830 | -14020 | -15070 | -15020 | -15360 | -14190 |
| Nigardsbreen (NO) | mm w.e. | 2970 | 5130 | 5350 | 4040 | 3480 | 4300 | 4160 | 5260 | 5740 | 6010 |
| Austre Broeggerbreen (NO) | mm w.e. | 0 | -650 | -750 | -1680 | -2220 | -2800 | -3110 | -3190 | -4110 | -4420 |
| Aalfotbreen (NO) | mm w.e. | -1950 | -670 | 280 | -1890 | -3120 | -2180 | -2290 | -110 | 920 | 2130 |
| Hofsjokull N (IS) | mm w.e. | ||||||||||
| Maladeta (ES) | mm w.e. | ||||||||||
| 1976 | 1977 | 1978 | 1979 | 1980 | 1981 | 1982 | 1983 | 1984 | 1985 | ||
| Careser (IT) | mm w.e. | -2710 | -1720 | -1640 | -1820 | -1810 | -2650 | -4330 | -5120 | -5710 | -6470 |
| Gries (CH) | mm w.e. | -3416 | -2250 | -1194 | -2079 | -1509 | -1833 | -3137 | -3916 | -3920 | -4446 |
| Hintereis (AT) | mm w.e. | -7221 | -6461 | -6050 | -6269 | -6319 | -6492 | -7732 | -8312 | -8280 | -8854 |
| Saint Sorlin (FR) | mm w.e. | -5960 | -4630 | -3770 | -3540 | -2630 | -2430 | -2890 | -3030 | -2650 | -3120 |
| Sarennes (FR) | mm w.e. | -18720 | -17730 | -17180 | -17290 | -16970 | -16930 | -17030 | -17100 | -17140 | -18350 |
| Vernagt (AT) | mm w.e. | 940 | 1292 | 1580 | 1624 | 1764 | 1709 | 864 | 327 | 347 | 235 |
| Storglaciaeren (SE) | mm w.e. | -13920 | -13720 | -13800 | -14010 | -15280 | -15470 | -15210 | -14930 | -14810 | -15530 |
| Nigardsbreen (NO) | mm w.e. | 6410 | 5640 | 5510 | 6220 | 5000 | 5310 | 4890 | 5980 | 6320 | 6100 |
| Austre Broeggerbreen (NO) | mm w.e. | -4870 | -4980 | -5540 | -6250 | -6770 | -7320 | -7360 | -7630 | -8360 | -8910 |
| Aalfotbreen (NO) | mm w.e. | 3660 | 3100 | 2590 | 2460 | 1850 | 2070 | 1940 | 3540 | 4860 | 4300 |
| Hofsjokull N (IS) | mm w.e. | ||||||||||
| Maladeta (ES) | mm w.e. | ||||||||||
| 1986 | 1987 | 1988 | 1989 | 1990 | 1991 | 1992 | 1993 | 1994 | 1995 | ||
| Careser (IT) | mm w.e. | -7610 | -9250 | -10260 | -11080 | -12660 | -14390 | -15590 | -15890 | -17630 | -18710 |
| Gries (CH) | mm w.e. | -5393 | -6126 | -7050 | -8121 | -10109 | -11453 | -12578 | -13630 | -13839 | -14117 |
| Hintereis (AT) | mm w.e. | -9586 | -10303 | -11248 | -11885 | -12880 | -14205 | -15325 | -15895 | -17005 | -17465 |
| Saint Sorlin (FR) | mm w.e. | -4690 | -5080 | -4920 | -7350 | -8510 | -9570 | -11310 | -12280 | -12610 | -11940 |
| Sarennes (FR) | mm w.e. | -20140 | -21060 | -21750 | -24340 | -26480 | -27840 | -29150 | -30350 | -30980 | -30220 |
| Vernagt (AT) | mm w.e. | -573 | -863 | -1360 | -1672 | -2240 | -3319 | -4177 | -4649 | -5677 | -6075 |
| Storglaciaeren (SE) | mm w.e. | -15590 | -15110 | -15950 | -14710 | -14120 | -13950 | -13070 | -12070 | -12440 | -11740 |
| Nigardsbreen (NO) | mm w.e. | 6000 | 7480 | 6590 | 10060 | 11830 | 12030 | 13630 | 15480 | 16040 | 17230 |
| Austre Broeggerbreen (NO) | mm w.e. | -9230 | -9010 | -9530 | -9980 | -10640 | -10510 | -10610 | -11640 | -11800 | -12580 |
| Aalfotbreen (NO) | mm w.e. | 3890 | 5960 | 3480 | 6410 | 8200 | 8990 | 11280 | 13460 | 14240 | 15440 |
| Hofsjokull N (IS) | mm w.e. | 0 | -740 | -160 | -760 | -2170 | -1110 | -200 | -120 | -800 | |
| Maladeta (ES) | mm w.e. | 0 | -327 | -359 | -8 | -651 | |||||
| 1996 | 1997 | 1998 | 1999 | 2000 | 2001 | 2002 | 2003 | 2004 | 2005 | ||
| Careser (IT) | mm w.e. | -20030 | -20960 | -23200 | -25000 | -26610 | -26860 | -28009 | -31326 | -32888 | -34893 |
| Gries (CH) | mm w.e. | -14634 | -15702 | -17755 | -18319 | -19304 | -19533 | -20523 | -23234 | -24380 | -25892 |
| Hintereis (AT) | mm w.e. | -18292 | -18883 | -20115 | -20976 | -21609 | -21782 | -22429 | -24243 | -24910 | -25971 |
| Saint Sorlin (FR) | mm w.e. | -12450 | -12610 | -14830 | -15870 | -17110 | -16950 | -18640 | -21590 | -24040 | -26540 |
| Sarennes (FR) | mm w.e. | -30220 | -30650 | -32990 | -34050 | -35584 | -35194 | -37514 | -40654 | -43474 | -46754 |
| Vernagt (AT) | mm w.e. | -6488 | -6975 | -7978 | -8086 | -8373 | -8597 | -8863 | -10996 | -11403 | -11926 |
| Storglaciaeren (SE) | mm w.e. | -12130 | -12760 | -13280 | -13460 | -12880 | -13580 | -14410 | -15450 | -15570 | -15640 |
| Nigardsbreen (NO) | mm w.e. | 16820 | 17290 | 18260 | 18430 | 20150 | 19931 | 19043 | 17884 | 17841 | 18939 |
| Austre Broeggerbreen (NO) | mm w.e. | -12750 | -13460 | -14320 | -14680 | -14700 | -15180 | -15760 | -16660 | -17780 | -18780 |
| Aalfotbreen (NO) | mm w.e. | 13560 | 13640 | 13750 | 13810 | 15800 | 13707 | 12177 | 9675 | 9575 | 10243 |
| Hofsjokull N (IS) | mm w.e. | -1580 | -2630 | -3310 | -3560 | -4900 | -5480 | -6480 | -7460 | -8820 | -9250 |
| Maladeta (ES) | mm w.e. | -444 | 68 | -887 | -1651 | -2551 | -2049 | -2860 | -3962 | -5478 | -6957 |
| 2006 | 2007 | 2008 | 2009 | 2010 | 2011 | 2012 | 2013 | 2014 | 2015 | ||
| Careser (IT) | mm w.e. | -36986 | -39731 | -41582 | -42919 | -43858 | -45780 | -45780 | -48240 | -49279 | -49410 |
| Gries (CH) | mm w.e. | -27887 | -29360 | -30961 | -31844 | -33151 | -35301 | -35301 | -37341 | -37883 | -40113 |
| Hintereis (AT) | mm w.e. | -27487 | -29285 | -30519 | -31701 | -32521 | -33940 | -33940 | -35501 | -36011 | -36133 |
| Saint Sorlin (FR) | mm w.e. | -27980 | -30230 | -32040 | -34690 | -35690 | -38710 | -38710 | -40840 | -41796 | -43136 |
| Sarennes (FR) | mm w.e. | -49134 | -51654 | -53994 | -57894 | -59424 | -63577 | -63577 | -66267 | -67637 | -69547 |
| Vernagt (AT) | mm w.e. | -12808 | -13774 | -14617 | -15576 | -16256 | -17211 | -17211 | -18366 | -18791 | -18935 |
| Storglaciaeren (SE) | mm w.e. | -17360 | -16950 | -16370 | -16900 | -17590 | -18650 | -18650 | -17970 | -19380 | -20270 |
| Nigardsbreen (NO) | mm w.e. | 17540 | 18587 | 19687 | 19917 | 19117 | 18286 | 18286 | 19560 | 19328 | 18985 |
| Austre Broeggerbreen (NO) | mm w.e. | -19510 | -19967 | -20097 | -20350 | -20790 | -21794 | -21794 | -21969 | -23019 | -23009 |
| Aalfotbreen (NO) | mm w.e. | 7053 | 8323 | 9003 | 8853 | 7013 | 6168 | 6168 | 7529 | 6625 | 4972 |
| Hofsjokull N (IS) | mm w.e. | -9760 | -10150 | -10720 | -11070 | -13470 | -13790 | -13790 | -14250 | -14610 | -15560 |
| Maladeta (ES) | mm w.e. | -8744 | -9691 | -9729 | -11143 | -10884 | -12388 | -12388 | -14859 | -14469 | -14391 |
Goals
- to adapt to climate change and to reduce potential negative impacts (extreme/exceptional weather events);
- to limit the rise of temperatures below 2oC compared to pre-industrial levels (Paris Agreement)
- to adopt urgent measures to combat climate change and its consequences (2030 Agenda for Sustainable Development);
- to promote adaptation to climate change in key vulnerable sectors (EU strategy on adaptation to climate change);
- to encourage Member States to adopt measures for protection against climate change (EU strategy on adaptation to climate change).
Comment
Similar oscillations within the last 400 years are typical of all Alpine glaciers. Following their peak at the beginning of the 17th century, glaciers remained at their maximum extent for the next 250 years, undergoing relatively insignificant changes. Most glaciers in the eastern Alps reached their second peak between 1770 and 1780, and in the mid-19th century. However, the post-1920 period records a continuous retreat of glaciers; the only variations occurring between individual years and decades were those concerning the rate of glacier retreat.
The melting of the Triglav glacier intensified during the 1990’s. The increasingly rapid thinning of the glacier ice caused individual rock formations to appear in the middle of the glacier, finally cutting it into two completely separate parts in 1992. The melting and disintegration of the Triglav glacier is still continuing, with occasional halts in the process occurring in years with exceptionally high snow cover during late spring. This occurred e.g. in 2004, when, at the beginning of July, snow measurement rods below the glacier revealed more than 2 m of snow. The snow cover remained in place until the end of the ablation season, so the glacier remained covered by snow and the measurements made no sense. The snow remained at the bottom of the glacier until the end of summer 2005, which is why the glacier’s surface area in this year was greater than in 2003. The smallest glacier area before 2016 was recorded in 2007, when it measured 0.6 ha. At the end of the melting season in 2008, the glacier was still mainly covered with snow from the previous winter season, and its measured surface area therefore amounted to 1.1 ha. The most significant glacier recovery occurred in 2009 and 2014, mostly thanks to above-average snow cover during two consecutive winters of 2008/09–2009/10 and 20012/13–2013/14, during which numerous avalanches were triggered as well. At the end of the melting season in 2010, when most of the glacier was covered with thick layers of old snow, the glacier’s surface area was 2.5 hectares. It was similar at the end of the melting season in 2014, when it measured 3.6 hectares.
In September 2013, georadar measurements were carried out (13 cross sections with a length of 40–82 m in the NNE–SSW direction). They revealed that the surface area of glacier ice was 0.38 hectares (2.5 hectares including the snow on top of and adjacent to the glacier), while its volume amounted to 7,400 m3. The greatest thickness in some places was 5 m and the average thickness was 1.95 m. Including the snow on top of and adjacent to the glacier, the greatest thickness was 8 metres, while the average thickness was no more than 3 metres.
The trend of ice build-up stopped during the melting season in 2015, when the glacier's surface area was reduced by more than 50%, to 1.7 hectares. Its thickness, and consequently its volume, was reduced even more (several metres in places). All of the firn that accumulated between 2005 and 2014 disappeared due to intensive melting. By the end of the melting season in 2016, only a few small patches of firn were preserved in the upper part of the glacier. It is impossible to precisely determine when the glacier will disappear, as it is not possible to precisely predict the course of local climate change in the Triglav glacier area that will result from global climate change. If unfavourable climate conditions for the glacier's growth continue in future years, it is highly probable that the glacier will further disintegrate into a larger number of smaller parts and gradually disappear.
When measurements began in the mid-1950s, the melting period was slightly shorter than the accumulation period, while in recent decades it has usually been the opposite. The glacier balance is very fragile, as current temperature conditions and other factors threaten the preservation of the Triglav glacier. If atmosphere warming continues at the rate witnessed in the last two decades, the glacier will eventually disappear. More snowfall in the area of the glacier, which is a possible result of global climate change, will only temporarily delay the glacier's gradual disappearance.
The average temperature of the melting season (May–October) was notably above the long-term average in the second half of the 1970s (0.3°C) and the second half of the 1980s (0.4°C). An exceptional temperature rise (0.7°C) occurred at the break of the 21st century, after which the average temperature of the melting season remained relatively stable. With regard to the reference period 1961–1990, the temperature of the melting season in 2016 was 0.8°C above the long-term average. A similar trend of warming and, consequently, retreating glaciers, is taking place throughout the Alps.


