[EN13] Efficiency of electricity production

Key message

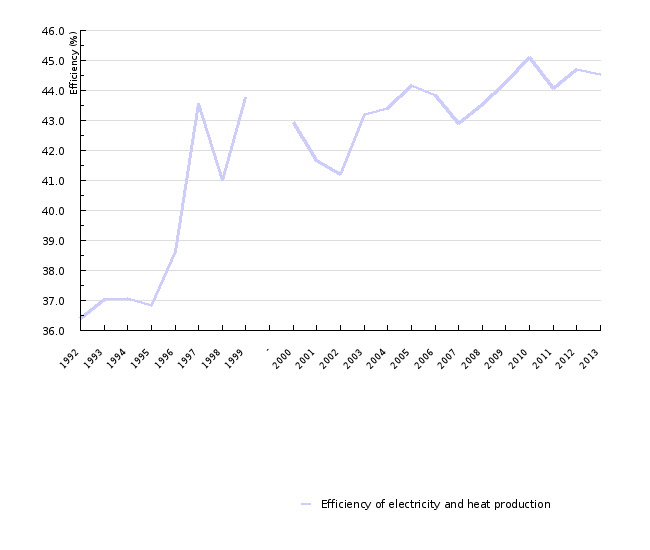
In the production of electricity and heat in thermal power plants and combined heat and power plants 55% of input energy was lost in the year 2010.
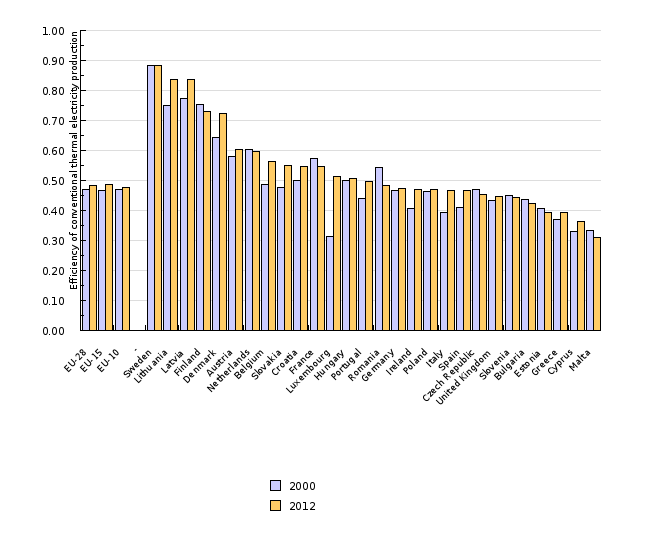
Due to a lack of new investments, the efficiency of electricity production and of electricity and heat production is improving too slowly. Compared to the EU-27, Slovenia produced electricity and heat 4 percentage points less efficiently.
Definition
The indicator shows the efficiency of electricity production, which is defined as the ratio of gross electricity production to the energy input in the form of fossil fuels (as well as wood biomass and waste). The efficiency of production of electricity and heat is defined as the ratio of gross electricity and heat production to the energy input in the form of fossil fuels (as well as wood biomass and waste). The indicator considers electricity and heat production and the consumption of fossil fuels in public thermal power plants, combined heat and power plants and autoproducers that do not have electricity and heat production as their primary activity.
Charts
Statistical Office of the Republic of Slovenia, 2012; Jožef Stefan Institute, 2012.
| 1992 | 1993 | 1994 | 1995 | 1996 | 1997 | 1998 | 1999 | - | 2000 | ||
|---|---|---|---|---|---|---|---|---|---|---|---|
| Fuel consumption in thermal power plants and cogeneration plants | ktoe | 1518.1 | 1501.9 | 1429.2 | 1483.8 | 1408.1 | 1333.6 | 1511.7 | 1317.9 | 1365.7 | |
| Gross electricity production | ktoe | 404.3 | 405.3 | 397.5 | 398.5 | 387.5 | 435.8 | 450.3 | 415 | 432.4 | |
| Gross electricity and heat production | ktoe | 552.6 | 555.9 | 529.6 | 546.3 | 544 | 581.2 | 619.5 | 576.6 | 586.1 | |
| Efficiency of electricity and heat production | % | 36.4 | 37 | 37.1 | 36.8 | 38.6 | 43.6 | 41 | 43.8 | 42.9 | |
| 2001 | 2002 | 2003 | 2004 | 2005 | 2006 | 2007 | 2008 | 2009 | 2010 | ||
| Fuel consumption in thermal power plants and cogeneration plants | ktoe | 1485 | 1559.6 | 1488.9 | 1504.3 | 1507.8 | 1553.7 | 1596.2 | 1604.8 | 1538.3 | 1562.8 |
| Gross electricity production | ktoe | 465.5 | 495.1 | 486.4 | 491.7 | 496.3 | 513.8 | 523 | 525.1 | 511.2 | 521.7 |
| Gross electricity and heat production | ktoe | 619 | 642.8 | 643.1 | 653 | 666 | 680.8 | 684.6 | 698.7 | 680.9 | 704.7 |
| Efficiency of electricity and heat production | % | 41.7 | 41.2 | 43.2 | 43.4 | 44.2 | 43.8 | 42.9 | 43.5 | 44.3 | 45.1 |
| 2011 | 2012 | 2013 | |||||||||
| Fuel consumption in thermal power plants and cogeneration plants | ktoe | 1587 | 1530.1 | 1481.4 | |||||||
| Gross electricity production | ktoe | 522.1 | 512.3 | 486.8 | |||||||
| Gross electricity and heat production | ktoe | 699.1 | 683.7 | 659.9 | |||||||
| Efficiency of electricity and heat production | % | 44.1 | 44.7 | 44.5 |
Eurostat, 2012.
| EU-28 | EU-15 | EU-10 | - | Sweden | Lithuania | Latvia | Finland | Denmark | Austria | ||
|---|---|---|---|---|---|---|---|---|---|---|---|
| 2000 | %/100 | 0.468 | 0.466 | 0.471 | 0.884 | 0.75 | 0.774 | 0.755 | 0.645 | 0.579 | |
| 2012 | %/100 | 0.484 | 0.486 | 0.478 | 0.883 | 0.837 | 0.835 | 0.729 | 0.725 | 0.604 | |
| Netherlands | Belgium | Slovakia | Croatia | France | Luxembourg | Hungary | Portugal | Romania | Germany | ||
| 2000 | %/100 | 0.604 | 0.487 | 0.476 | 0.499 | 0.574 | 0.313 | 0.5 | 0.441 | 0.545 | 0.467 |
| 2012 | %/100 | 0.596 | 0.563 | 0.549 | 0.548 | 0.547 | 0.513 | 0.508 | 0.496 | 0.485 | 0.475 |
| Ireland | Poland | Italy | Spain | Czech Republic | United Kingdom | Slovenia | Bulgaria | Estonia | Greece | ||
| 2000 | %/100 | 0.407 | 0.465 | 0.394 | 0.408 | 0.471 | 0.434 | 0.45 | 0.435 | 0.407 | 0.371 |
| 2012 | %/100 | 0.47 | 0.469 | 0.466 | 0.465 | 0.454 | 0.445 | 0.442 | 0.423 | 0.393 | 0.393 |
| Cyprus | Malta | ||||||||||
| 2000 | %/100 | 0.329 | 0.335 | ||||||||
| 2012 | %/100 | 0.364 | 0.311 |
Goals
- to increase the efficiency of electricity and heat production through technological improvements to the transformations sector, switching of fuel and increased share of combined heat and power (cogeneration).
Methodology
Data for Slovenia and other countries
Objectives summarised by: Resolucija o Nacionalnem energetskem programu (Resolution on the National Energy Programme, Official Gazette of the Republic of Slovenia, No. 57/04).
Source database or data source:
Gross electricity production:
Slovenia
- 1992-1995: Filled in Joint Annual Questionnaires submitted to EUROSTAT by the Statistical Office of the Republic of Slovenia
- 1996-2010: SI-STAT data portal available through the website of the Slovenian Statistical Office: Environment and natural resources > Energy > Electricity > Electricity generation, fuel use and net power in public power plants, of autoproducers and small hydro-power plants, Slovenia, annually; (Power plants by plant type + autoproducers) – gross production
EU-27
- Database available on EUROSTAT’s website: Environment and energy > Energy > Energy Statistics – quantities > Energy Statistics – supply, transformation, consumption > Supply, transformation, consumption – electricity – annual data > 101101 Output from conventional thermal power stations
Heat production:
Slovenia
- 1992-1999: Filled in Joint Annual Questionnaires submitted to EUROSTAT by the Statistical Office of the Republic of Slovenia
- 2000-2010: SI-STAT data portal available through the website of the Slovenian Statistical Office: Environment and Natural Resources > Energy > Energy Balance and Energy Indicators > Energy balance (1000 toe), Slovenia, annually (Transformations – combined heat and power plants - Total: Heat)
EU-27
- Database available on EUROSTAT’s website: Environment and energy > Energy > Energy Statistics – quantities > Energy Statistics – supply, transformation, consumption > Supply, transformation, consumption – heat – annual data> B_101101 Output from conventional thermal power stations
Consumption of fossil fuels (coal, petroleum products and natural gas) and wood biomass for the production of electricity and heat:
Slovenia
- 1992-1999: The Energy Balance as prepared on the basis of data from the filled in Joint Annual Questionnaires submitted to EUROSTAT by the Statistical Office of the Republic of Slovenia (see EN26)
- 2000-2008: SI-STAT data portal available through the website of the Slovenian Statistical Office: Environment and Natural Resources > Energy > Energy Balance and Energy Indicators > Energy balance (1000 toe), Slovenia, annual. (Transformation – electricity plants, Transformation – autoproducers and Transformation – CHP plants, Transformation – CHP plants – autoproducers)
EU-27
- Database available on EUROSTAT’s website: Environment and energy > Energy > Energy Statistics – quantities > Energy Statistics – supply, transformation, consumption > Supply, transformation, consumption - all products - annual data > B_101001 Input to conventional thermal power stations.
Data administrator: the Statistical office of the Republic of Slovenia (Jože Zalar, Mojca Suvorov) or EUROSTAT.
Data acquisition date for the indicator: 6 March 2012
Methodology and frequency of data collection for the indicator: Data are prepared on an annual basis.
Data processing methodology: Efficiency is calculated as the ratio of electricity production or the production of both electricity and heat in thermal power plants to the consumption of fossil fuels, wood biomass or waste. The indicator is expressed in percentage points.
Annual growth is occasionally shown in percentage points. A percentage point is a unit used in comparing different percentages. In percentage points, we are dealing with an absolute comparison calculated using the following formula: (nthis year) – (nlast year) = 16 % – 15 % = 1 pp (e.g. if there was a 15 % growth last year and a 16 % growth this year, then this year growth is 1 percentage point higher). The difference in growth can also be expressed by relative comparison using the following formula: [(nthis year/nlast year) * 100] – 100 = [(16 % / 15 %) * 100] – 100 = 6.7 %. In this case, growth is expressed in percentage points.
Geographical coverage: The EU-27 countries are the EU Member States: Austria, Belgium, Bulgaria, Cyprus, the Czech Republic, Denmark, Estonia, Finland, France, Germany, Greece, Hungary, Ireland, Italy, Latvia, Lithuania, Luxembourg, Malta, the Netherlands, Poland, Portugal, Romania, Slovakia, Slovenia, Spain, Sweden, the United Kingdom. The EU-25 countries are the EU Member States excluding Bulgaria and Romania. The EU-15 are the EU Member States prior to enlargement (Austria, Belgium, Denmark, Finland, France, Germany, Greece, Ireland, Italy, Luxemburg, the Netherlands, Portugal, Spain, Sweden and the United Kingdom). The EU-10 countries are Member States that acceded to the EU in 2004 (Cyprus, the Czech Republic, Estonia, Hungary, Latvia, Lithuania, Malta, Poland, Slovakia and Slovenia).
Information concerning data quality:
- Advantages and disadvantages of the indicator: The quality of data used for the indicator for the 1992-1999 period is questionable due to changes in the statistical processing of data (e.g. at the beginning of the period, the entire consumption of fuel by autoproducers was included in transformations, while at the end of the period only the part that was intended for the production of electricity and heat intended for sale, which improved the efficiency). This is why only the calculations for the 2000-2008 period have been used in analysing indicator trends.
- Relevance, accuracy, robustness, uncertainty (at data level):
Reliability of the indicator (archival data): Data reliability for the 1992-1999 period is limited due to reasons described above, while data for the 2000-2008 period are reliable, as a single source has been used (the Statistical Office of the Republic of Slovenia) and data have been processed using the same methodology.
Uncertainty of the indicator (scenarios/projections): Scenarios and projections are not available.
- Overall assessment (1 = no major comments, 3 = data to be considered with reservation):
Relevance: 1
Accuracy: 2
Completeness over time: 2
Completeness over space: 1
Other sources and literature:
- EEA, 2012. ENer19 Efficiency of conventional thermal electricity production.
- EC, 2011. Proposal for a Directive on energy efficiency and repealing Directives 2004/8/EC and 2006/32/EC [COM(2011)370, 22/06/2011]
- Ministry of the Environment and Spatial Planning, 2009. Operativni program zmanjševanja emisij toplogrednih plinov do leta 2012 (Operational Programme for Limiting Greenhouse Gas Emissions by 2012).
- Šoštanj Thermal Power Plant, 2011. BilTEŠ 2010- Annual reports.
- Point Carbon, 2012. Point Carbon web page: http://www.pointcarbon.com/.
- Urbančič, et. al, 2011, NEP 2011 - Dolgoročne energetske bilance NEP do leta 2030 – IZHODIŠČA.
- Urbančič, et. al, 2011a, NEP 2011 - Dolgoročne energetske bilance NEP do leta 2030 – REZULTATI.


