[PR10] Transport accident fatalities 

Key message

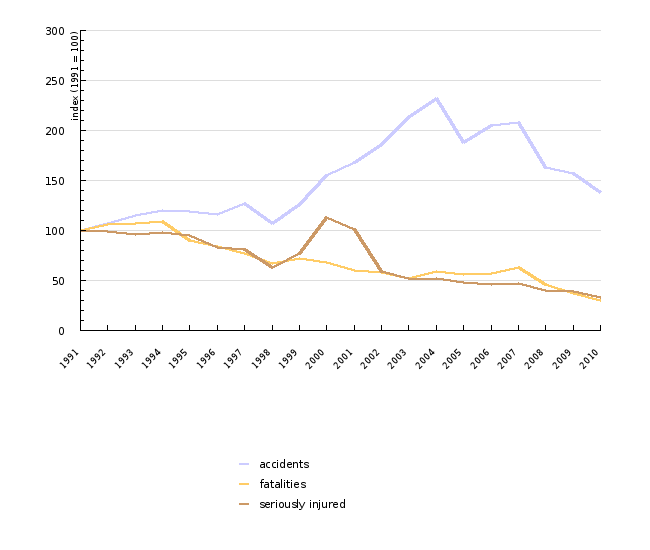
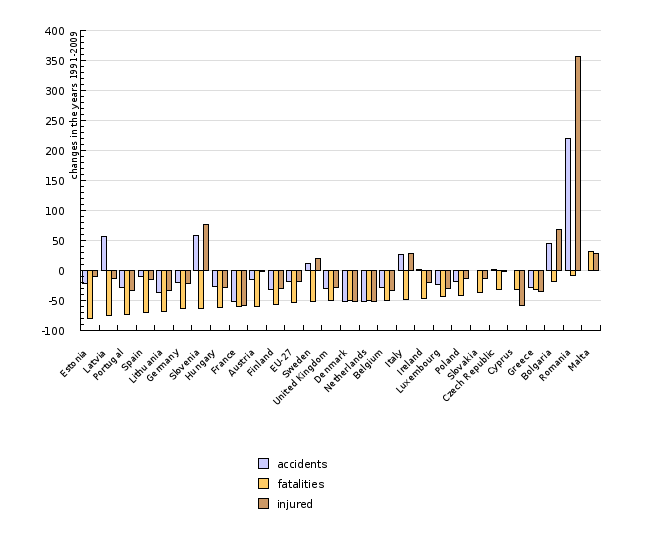
Although the annual number of road transport fatalities in Slovenia has been decreasing for decades and has almost halved in the last 20 years, it is still too high – traffic accidents in the last ten years took around 250 lives annually. Of major concern is also the recent increase in the number of these accidents and injured persons, due to the extreme increase in transport. Fortunately, the number of accidents has decreased since 2005.
Definition
The indicator defines the number of traffic accidents, fatalities and injuries in road transport for the period 1991-2007 in Slovenia and in other EU countries. This includes all traffic accidents in road transport, in the inspection of which the police cooperated and which occurred in the current year. Fatalities are all persons killed outright or within 30 days as a result of the accident. Injured persons are all persons not killed, but injured in an accident and who usually needed medical treatment (CARE, 2009). Accidents in rail, maritime and air transport are not included due to their minimum share.
Charts
Statistical Office of the Republic of Slovenia: Statistical Yearbook of the Republic of Slovenia 1995-2010 and SI-STAT Data Portal, 2011
| 1991 | 1992 | 1993 | 1994 | 1995 | 1996 | 1997 | 1998 | 1999 | 2000 | ||
|---|---|---|---|---|---|---|---|---|---|---|---|
| accidents | index (1991 = 100) | 100 | 107 | 115 | 120 | 119 | 116 | 127 | 107 | 126 | 155 |
| fatalities | index (1991 = 100) | 100 | 106 | 107 | 109 | 90 | 84 | 77 | 67 | 72 | 68 |
| seriously injured | index (1991 = 100) | 100 | 99 | 96 | 98 | 95 | 83 | 81 | 63 | 77 | 113 |
| accidents | number | 5479 | 5882 | 6290 | 6586 | 6540 | 6348 | 6968 | 5837 | 6929 | 8469 |
| fatalities | number | 462 | 492 | 493 | 505 | 415 | 389 | 357 | 309 | 334 | 313 |
| seriously injured | number | 2660 | 2642 | 2555 | 2613 | 2537 | 2197 | 2156 | 1685 | 2047 | 2995 |
| 2001 | 2002 | 2003 | 2004 | 2005 | 2006 | 2007 | 2008 | 2009 | 2010 | ||
| accidents | index (1991 = 100) | 168 | 186 | 213 | 232 | 188 | 205 | 208 | 163 | 157 | 138 |
| fatalities | index (1991 = 100) | 60 | 58 | 52 | 59 | 56 | 57 | 63 | 46 | 37 | 30 |
| seriously injured | index (1991 = 100) | 101 | 59 | 52 | 52 | 48 | 46 | 47 | 40 | 39 | 33 |
| accidents | number | 9199 | 10199 | 11676 | 12721 | 10309 | 11223 | 11414 | 8938 | 8589 | 7560 |
| fatalities | number | 278 | 268 | 242 | 274 | 258 | 262 | 293 | 214 | 171 | 138 |
| seriously injured | number | 2689 | 1564 | 1393 | 1391 | 1266 | 1220 | 1263 | 1068 | 1032 | 865 |
Road safety evolution in EU. CARE – European Road Accident Database, European Commission, 2011.
| Estonia | Latvia | Portugal | Spain | Lithuania | Germany | Slovenia | Hungary | France | Austria | ||
|---|---|---|---|---|---|---|---|---|---|---|---|
| accidents | % | -21.7 | 57.4 | -27.5 | -10.1 | -36.9 | -19.3 | 59.1 | -27.4 | -51.4 | -15.2 |
| fatalities | % | -80 | -74.5 | -73.9 | -69.3 | -68.5 | -63.3 | -63 | -61.2 | -59.2 | -59.2 |
| injured | % | -9.4 | -13.5 | -32.7 | -15.8 | -32.8 | -21.9 | 77.4 | -28.8 | -58.9 | -1.1 |
| Finland | EU-27 | Sweden | United Kingdom | Denmark | Netherlands | Belgium | Italy | Ireland | Luxembourg | ||
| accidents | % | -31.6 | -17.6 | 11.5 | -29.9 | -52.3 | -52.4 | -28 | 26.2 | 1.9 | -22.8 |
| fatalities | % | -55.9 | -53.8 | -51.9 | -50.8 | -50 | -49.7 | -49.6 | -47.7 | -46.3 | -43.4 |
| injured | % | -30.2 | -17.9 | 19.8 | -27.6 | -51.8 | -51.6 | -33.3 | 27.6 | -20.4 | -29.6 |
| Poland | Slovakia | Czech Republic | Cyprus | Greece | Bolgaria | Romania | Malta | ||||
| accidents | % | -18.2 | np | 1.1 | np | -28.8 | 45 | 219.8 | np | ||
| fatalities | % | -42.1 | -37.5 | -32.3 | -31.1 | -31.1 | -19.1 | -9.2 | 31.3 | ||
| injured | % | -14.1 | -13.3 | -0.9 | -58.6 | -35.5 | 67.8 | 356.1 | 28.7 |
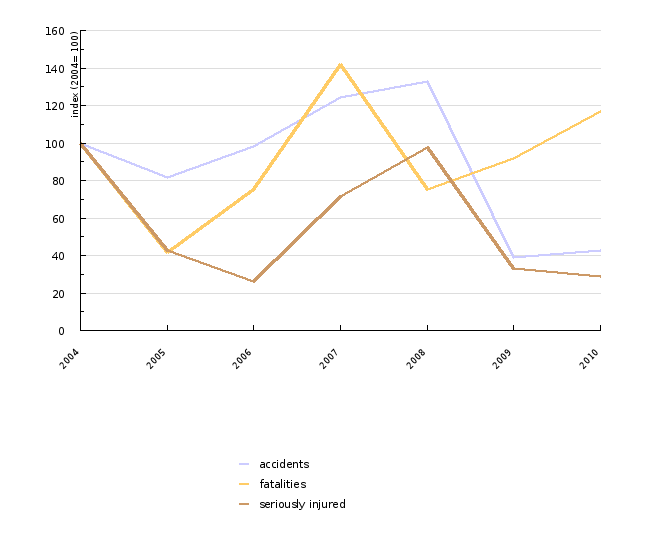
Statistical Office of the Republic of Slovenia, SI-STAT Data Portal, 2011
| 2004 | 2005 | 2006 | 2007 | 2008 | 2009 | 2010 | ||
|---|---|---|---|---|---|---|---|---|
| accidents | index (2004 = 100) | 100 | 82 | 98 | 124 | 133 | 39 | 43 |
| fatalities | index (2004 = 100) | 100 | 42 | 75 | 142 | 75 | 92 | 117 |
| seriously injured | index (2004 = 100) | 100 | 43 | 26 | 71 | 98 | 33 | 29 |
| accidents | number | 49 | 40 | 48 | 61 | 65 | 19 | 21 |
| fatalities | number | 12 | 5 | 9 | 17 | 9 | 11 | 14 |
| seriously injured | number | 42 | 18 | 11 | 30 | 41 | 14 | 12 |
Goals
- Reduction of the number of fatalities in traffic accidents to 124 victims by the end of 2011, which would save approximately 600 lives in the period 2007-2011 (Resolution on National Programme on Road Traffic Safety 2007–2011).
- Increase of road traffic safety with the accelerated construction of the motorway network and bypasses, non-level crossings of traffic routes, improvement of the vehicle fleet, education of drivers and their awareness as well as stricter monitoring of traffic violations (Operational Programme of Environmental and Transport Infrastructure Development for the Period 2007–2013.
- Improvement of safety in rail transport, with an emphasis on the improvement of traffic culture of participants and better protection or elimination of level crossings of roads with railways (Operational Programme of Environmental and Transport Infrastructure Development for the Period 2007–2013.
Comment
In the countries of the EU, 137 road transport participants died per million residents in 1995. In the same year in Slovenia, 208 road transport participants died, by which Slovenia exceeded the European average by 52 %. According to this criterion, Slovenia belonged in 1995 to the least safe European countries. In the last ten years, the number of fatalities on our roads has slightly decreased (in 2007, 145 fatalities per million residents). However, Slovenia is still exceeding the EU average by 69 %; in the EU, 86 persons died in road transport per million residents.
The objectives and measures for the particularly pressing transport subsystem are for the period 2007-2011 stipulated in the Resolution on National Programme on Road Traffic Safety (OG RS, no. 2/2007). The resolution has established that road safety in Slovenia has been unacceptable and unsatisfactory for a long time, and has been strongly reducing the quality of life in our society and of its members. In the period 1995-2007 in Slovenia, almost 3600 persons died due to traffic accidents. As an answer to this problem, the resolution is following the example of other European countries and setting to the foreground the vision »zero«, which represents a positive and responsible relationship of the creators and participants of the road-transport system who are, with their comprehensive operations and management, obliged to prevent the worst consequences of traffic accidents and provide a safe long-term objective: zero fatalities and zero seriously injured persons due to traffic accidents. The main objective of the programme is to keep the number of fatalities in traffic accidents in 2011 under 124. Considering the trends in recent years, when on average less people died in traffic accidents with regard to previous years, this would save approximately 600 lives by 2011. The resolution is considering five of the most exposed categories of road transport participants – pedestrians, cyclists, young drivers of passenger cars (15-24 years), elderly drivers of passenger cars (above 65) and drivers of motorcycles, who are primarily considered to be possible victims of traffic accidents. Besides the five most endangered groups of road transport participants, the Resolution draws attention to two of the most frequent causes for traffic accidents – speed and alcohol or illegal drugs and other psychoactive substances. Despite the decrease in the number of fatalities in road transport, the number of traffic accidents and injured in Slovenia, including the social costs, has been increasing above average. The annual number of traffic accidents resulting in injured people has, after 1995, increased by 78 % or 100 % respectively. There are different causes for this problem, although the majority of them come from above-average motorisation and an increase in road motor transport as well as the abandonment of safer transport modes (especially public transport).
The European Environment Agency explains the causes of such trends (less victims and more accidents and injured) in new EU Member States (EEA, 2005):
- with improved technologies of newer vehicles and their higher safety standards;
- with higher road quality, their engineering and road signalisation;
- with legislative changes in connection with driving under the influence of alcohol;
- with the introduction and implementation of stricter speed limits.
The European Commission has also been dealing a lot with road-transport safety. In 2003, it presented a new Road Safety Action Programme, which contains three main areas of action (EEA, 2005):
- encouraging road users to more responsible behaviour, especially through stricter compliance with the existing legislation, having continuous training for private and commercial drivers, and more efficient persecution of dangerous behaviour (driving under the influence of alcohol and drugs); improving police checks and promoting education and road user awareness campaigns.
- making use of the technological progress of the safety of vehicles with the improvement of safety standards;
- encouraging improvements in road infrastructure, especially by determining and spreading the examples of the best practice and eliminating accident black spots.
Methodology
Data for Slovenia and other countries:
Objectives summarised by: Resolution on National Programme on Road Traffic Safety 2007–2011, OG RS, no. 2/2007 and Operational Programme of Environmental and Transport Infrastructure Development for the Period 2007–2013.
Source database or source: Road safety evolution in EU, CARE – European Road Accident Database (17 July 2009).
Data administrator: European Commission, Directorate-General for Energy and Transport.
Date of acquisition for this indicator: 17 July 2009.
Methodology and frequency of data collection for the indicator: The data is updated on an annual basis.
Data processing methodology: /
Information concerning data quality:
- Advantages and disadvantages (at data level): Due to different definitions of traffic accidents, fatalities and injuries in road transport in individual countries and the application correction factors for this, the comparability of data sources can be questionable sometimes.
- Relevance, accuracy, robustness, uncertainty: The data can be considered as quite accurate and reliable.
Reliability of the indicator (archive data): The data refers to a longer time period.
Uncertainty of the indicator (scenarios/projections): Projections have not been prepared.
- Overall assessment (1 = no major comments, 3 = data to be considered with reservation): 1
Relevance: 1
Accuracy: 1
Completeness over time: 1
Completeness over space: 2 (definitions of traffic accidents, fatalities and injuries in road transport are slightly different in various countries)
Other sources and literature:
- EEA, 2005. TERM 2005 09 – Number of transport accidents, fatalities and injuries (land, air and maritime). Indicator fact sheet. European Environment Agency (17 July 2009).
- Resolution on National Programme on Road Traffic Safety 2007–2011. OG RS, no. 2/2007.


