[RE05] Public attitude towards battery-powered electric vehicles and plug-in hybrids

Key message

The survey results show that between 2010 and 2019, the share of households considering the purchase of an electric or a hybrid passenger car statistically significantly increased. Statistical data for registered vehicles shows that, during 2014-2019, the share of new registered electric and hybrid passenger cars slightly increased. In comparison to 20 European countries Slovenia ranks in the middle.
Charts
Survey on Energy Efficiency in Slovenia, Informa Echo d.o.o., 2019
| 0[%] | 1[%] | 2[%] | 3 or more[%] | I don't know[%] | |
|---|---|---|---|---|---|
| 2010 | 14 | 45 | 30 | 11 | 0 |
| 2011 | 15 | 45 | 29 | 11 | 0 |
| 2012 | 20 | 43 | 25 | 12 | 0 |
| 2015 | 8 | 51 | 33 | 8 | 0 |
| 2017 | 4 | 48 | 37 | 10 | 0 |
| 2019 | 9 | 49 | 32 | 9 | 1 |
Survey on Energy Efficiency in Slovenia, Informa Echo d.o.o., 2019
| up to 690 EUR[%] | 691 EUR-1,380 EUR[%] | 1,381 EUR - 2,070 EUR[%] | 2,071 EUR - 2,760 EUR[%] | above 2,761 EUR[%] | |
|---|---|---|---|---|---|
| 2010 | 43 | 11 | 3 | 0 | 0 |
| 2011 | 51 | 21 | 3 | 0 | 0 |
| 2012 | 50 | 15 | 4 | 2 | 0 |
| 2015 | 39 | 11 | 1 | 0 | 0 |
| 2017 | 14 | 8 | 1 | 0 | 0 |
| 2019 | 22 | 13 | 2 | 5 | 3 |
Survey on Energy Efficiency in Slovenia, Informa Echo d.o.o., 2019
| up to 2 years[%] | 2-4 years[%] | 5-9 years[%] | 10-14 years[%] | 15+ years[%] | I don't know[%] | |
|---|---|---|---|---|---|---|
| 2010 | 12 | 30 | 48 | 28 | 13 | 0 |
| 2011 | 9 | 31 | 47 | 41 | 15 | 1 |
| 2012 | 7 | 28 | 49 | 44 | 15 | 1 |
| 2015 | 11 | 23 | 46 | 41 | 19 | 1 |
| 2017 | 11 | 21 | 45 | 41 | 24 | 1 |
| 2019 | 13 | 24 | 45 | 44 | 29 | 0 |
Survey on Energy Efficiency in Slovenia, Informa Echo d.o.o., 2019
| Completely unlikely[%] | Unlikely[%] | Not likely, not unlikely[%] | Likely[%] | Not likely[%] | Definitely[%] | I don't know[%] | |
|---|---|---|---|---|---|---|---|
| 2010 | 72 | 16 | 4 | 5 | 2 | 2 | 0 |
| 2011 | 64 | 19 | 7 | 7 | 2 | 1 | 1 |
| 2012 | 70 | 17 | 6 | 4 | 1 | 1 | 0 |
| 2015 | 51 | 29 | 8 | 7 | 2 | 1 | 1 |
| 2017 | 33 | 32 | 14 | 13 | 4 | 2 | 1 |
| 2019 | 36 | 27 | 15 | 11 | 3 | 2 | 6 |
Survey on Energy Efficiency in Slovenia, Informa Echo d.o.o., 2019
| Completely unlikely[%] | Unlikely[%] | Not likely, not unlikely[%] | Likely[%] | Not likely[%] | Definitely[%] | I don't know[%] | |
|---|---|---|---|---|---|---|---|
| 2010 | 66 | 15 | 7 | 8 | 2 | 2 | 0 |
| 2011 | 74 | 16 | 5 | 3 | 1 | 1 | 0 |
| 2012 | 75 | 17 | 3 | 4 | 1 | 1 | 0 |
| 2015 | 57 | 25 | 7 | 7 | 1 | 1 | 2 |
| 2017 | 37 | 30 | 15 | 12 | 2 | 1 | 3 |
| 2019 | 48 | 22 | 14 | 8 | 1 | 1 | 6 |
EUROSTAT, 2018
| Norway[%] | Romania[%] | Liechtenstein[%] | Malta[%] | Austria[%] | Sweden[%] | Switzerland[%] | France[%] | Germany[%] | Ireland[%] | Spain[%] | Slovenia[%] | Belgium[%] | Hungary[%] | Finland[%] | Latvia[%] | Estonia[%] | Lithuania[%] | Croatia[%] | Cyper[%] | |
|---|---|---|---|---|---|---|---|---|---|---|---|---|---|---|---|---|---|---|---|---|
| 2018 | 33 | 3.40 | 2.60 | 2.10 | 2 | 2 | 1.80 | 1.40 | 1 | 1 | 0.80 | 0.70 | 0.70 | 0.60 | 0.60 | 0.50 | 0.30 | 0.20 | 0.10 | 0.10 |
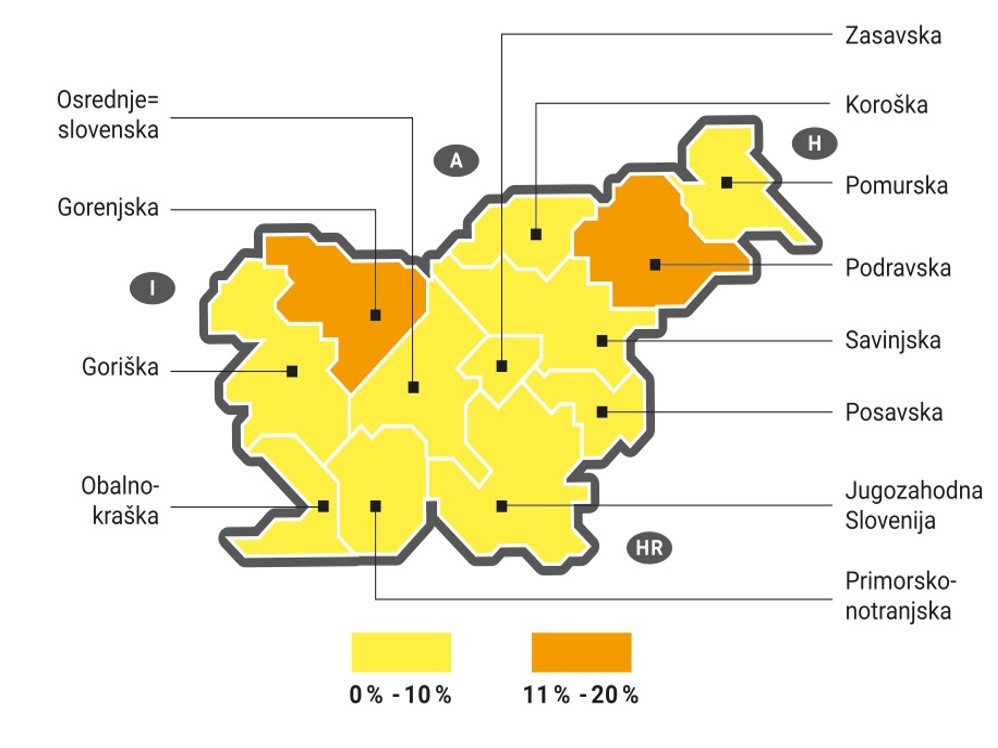
Survey on Energy Efficiency in Slovenia, Informa Echo d.o.o. (26th Feb, 2019)
| % | 0 % - 10 % | 11 % - 20 % | |
| Pomurska | 10 | 1 | 0 |
| Podravska | 18 | 0 | 1 |
| Koroška | 8 | 1 | 0 |
| Savinjska | 9 | 1 | 0 |
| Zasavska | 7 | 1 | 0 |
| Posavska | 3 | 1 | 0 |
| Jugovzhodna Slovenija | 5 | 1 | 0 |
| Osrednjeslovenska | 9 | 1 | 0 |
| Gorenjska | 14 | 0 | 1 |
| Primorsko-notranjska | 8 | 1 | 0 |
| Goriška | 4 | 1 | 0 |
| Obalno-kraška | 9 | 1 | 0 |
| All regions | 10 | 2 |


